This dataset was collected and predicted on the country scale, the data from 1992 to 2019/2020 were obtained from the FAOSTAT and resourcetrade.earth websites, and that from 2020/2021-2050 were predicted using the optimizing time-series method. Three types of data including the production, consumption and trade of major agricultural products were sorted, thereinto the production data inculde the total production, yield and harvested area of crops, vegetables and fruits, and total production of livestock (meat and milk). The concumption data include major food crops (wheat, rice, barley, maize and others), vegetables and fruits, and livestock (meat and milk). The trade data include the amounts and values of import and export from the three major agricultural products.
YANG Yonghui, HAN Shumin
")
This data set is based on the field survey data on farmland production, operation and management in Tibet's one river and two rivers region, Southeast Tibet, Sichuan Tibet East Hengduan Mountain Area in 2020. Sample selection: for the areas of one river and two rivers in Tibet, Southeast Tibet, and Hengduan Mountain Area in East Sichuan and Tibet, first, the typical sampling method is used to determine the sample counties, sample towns, and sample villages; Then, according to the basic situation of farmers, one sample Township and one sample village are selected from each county. Finally, one farmer is randomly selected from each sample village by using the random sampling method. The data set records the basic information of the investigated land, the basic information of the interviewed farmers, including education level, consumption level and other information, agricultural planting area, etc. The data set is the data obtained through field investigation and interview, which can be used to analyze the basic situation of agricultural planting on the Qinghai Tibet Plateau, and provide a theoretical basis for further improving the countermeasures and suggestions of government support policies.
TANG Yawei TANG Yawei
")
This dataset is based on the Tibet Statistical Yearbook and Qinghai Statistical Yearbook (2020). The two books contain statistical data on the economic and social development of the Tibet Autonomous Region and Qinghai Province since 2019, mainly from 1951 to 2020. Extract the agricultural aspects, from the basic situation of rural areas and agriculture, the basic situation of rural areas, rural employees, the total output value of agriculture, forestry, animal husbandry and fishery in sub-regional cities, the sown area of main crops, the output of main agricultural products, the output per unit area of main agricultural products, and the sown area of crops It is an important statistical data for people from all walks of life at home and abroad to understand the Qinghai-Tibet Plateau and the Qinghai-Tibet Plateau.
TANG Yawei TANG Yawei

This data comes from a random questionnaire survey conducted in the one-river-two-river region of Tibet, southeastern Tibet, and Hengduan mountainous area of eastern Sichuan and Tibet during July-August 2020. The data set mainly includes agricultural waste utilization data (straw utilization and livestock and poultry wastes). Utilization methods), straw utilization methods mainly include returning to the field, fuel, feed and compost, and livestock and poultry manure utilization methods mainly include fuel and fertilizer. The interviewees were mainly adults who were familiar with the family situation. In some villages, the output was calculated in small groups. The questionnaire design is based on the principles of scientificity, applicability, feasibility, typicality and specificity, and the "Household Questionnaire" is designed for the above areas. In order to ensure the reliability and validity of the questionnaire design content, the questionnaire was pre-investigated before the formal investigation, and there were problems in further modifying and improving the questionnaire. Before the official start of the questionnaire, the investigators were given the explanation of the content of the questionnaire and the training of investigation skills.
SONG Dagang SONG Dagang
")
The evaluation of the potential of cropland development under the influence of future climate change changes was carried out for the sustainable development of agriculture in five Central Asian countries, with cropland as the target. The evaluation factors of cropland development potential include: topographic factors (elevation, slope, slope direction, distance to water resources), soil factors (salinity, soil texture, soil organic matter content, soil pH), climate factors (rainfall, temperature, solar radiation), and economic factors (road density, population density). Using 2020 as the base year, the future potential for cropland development in Central Asia under the SSP5-8.5 scenario was estimated using the average precipitation and temperature from the ESM1 climate model in CMIP6, with other indicators held constant. The data provide evaluation results of the cropland development potential of the five Central Asian countries for the time periods 2020s, 2030s (2021-2040) and 2050s (2041-2060) with a spatial resolution of 0.01° × 0.01°. The dataset can provide basic data support for future land resource development and utilization and agricultural development in the five Central Asian countries.
JIANG Xiaohui, ZHANG Junjun
")
The population, grain, grain sown area and year-end data sets are extracted from the provincial and prefecture level statistical yearbooks of Qinghai, Tibet, Xinjiang, Gansu, Sichuan and Yunnan for many consecutive years. The missing data are interpolated as follows: 1. To ensure the accuracy of county data, Some counties and cities have been merged in this data (there may be errors in dividing and imputing the data for 20 years according to the proportion, but there will certainly be no problem in the merger, and the county area is small, so it is merged). 2. Xiahe County and cooperative city are merged into Xiahe County (cooperative city was separated from Xiahe County in 1998). 3. Gucheng district and Yulong County are merged into Gucheng district (Lijiang County was divided into Gucheng district and Yulong County in 2003). 4. The inner city district, East City District, West City District The four districts in Chengbei district have been merged into the district directly under the central government of Xining City (because the population of the four districts is given separately or the sum is given, and the total area of the four districts is only 487 square kilometers, they are merged). 5. For some missing data, curve fitting has been carried out in combination with similar years, and R2 is between 0.85-0.99. 6. In order to ensure the accuracy of the data, change maps have been prepared County by county
ZHANG Lu
")
The ecological resource consumption data set of Qinghai Province includes the ecological resource consumption data of 2000-2019 at the provincial, municipal and county levels. According to the actual situation of Qinghai Province, the ecological resource consumption mainly refers to the amount of ecological resources consumed in agricultural and animal husbandry production activities. The calculation of ecological resource consumption is based on grain production data, livestock stock data and livestock product production data, combined with the evaluation method of human occupied net primary productivity (HANPP), convert the biomass data into carbon content data, and then calculate the ecological resource consumption. Ecological resource consumption data is the basic data for the study of ecological pressure and ecological carrying capacity, which can directly reveal the pressure of human agricultural and animal husbandry production activities on the ecosystem.
HU Yunfeng
")
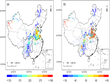
The food supply resilience of countries along the Belt and Road reflects the level of food supply resilience of the countries along the Belt and Road, and the higher the value of the data, the stronger the food supply resilience of the countries along the Belt and Road. The food supply resilience data products were prepared by referring to the FAO FAOSTAT database country-specific statistics, using year-by-year data on cereal production in countries along the Belt and Road from 2000 to 2019, and generating food supply resilience products through comprehensive diagnosis based on sensitivity and adaptation analysis, taking into account year-by-year changes. The grain supply resilience dataset for countries along the Belt and Road is an important reference for analysing and comparing the current state of grain supply resilience in each country.
XU Xinliang
")
Naked barley, called highland barley in Tibet, is the main crop of the Tibetan plateau and the main food of the Tibetan people. It has a long planting history, the largest planting area, the widest distribution and the highest planting ceiling. As for the autonomous region, the annual sown area and total grain output account for more than half of the total sown area and total grain output. In river valleys below 4,200 meters, they account for 30-50% of the area sown to local crops. In the alpine farming area of 4,200-4,500 meters above sea level, it accounts for 70-90% of the planting area of local crops. Naked barley is almost the only crop at agricultural sites above 4,500 meters. Tibetan bare barley has strong cold and drought resistance and ADAPTS to the plateau climate conditions. It is distributed in the vast agricultural areas and farming-pastoral interlacing areas from more than 1,000 meters to 4,500 meters above sea level. At present, the upper limit of planting reaches 4750 meters, which is the highest limit of crop distribution in Tibet. In 1974, a comprehensive scientific expedition to the Qinghai-Tibet Plateau entered Tibet from Sichuan province and carried out investigations along the route. During a survey of wild barley in Jitang district, Chaya County, Qamdo region, Tibetan members provided information about semi-wild wheat, which is similar to wheat in morphology but has broken cob at maturity, and is generally mixed with highland barley and wheat fields as a field weed. Plant specimens and seeds were collected. When the expedition team arrived at the Institute of Agricultural Science and Technology of Tibet Autonomous Region, they learned that comrades Cheng Tianqing and Dong Yuao had collected a kind of wheat with broken cob at maturity in SAN 'an Qu Lin, Longzi County, Shannan Prefecture in 1962, which belonged to the same type as the materials we had collected in other areas of Tibet. Later, in the Xigaze regional agricultural research institute, Comrade Tan Changhua said that he had also seen this kind of wheat when the cob broke at maturity in Renbu County. In addition to the above areas, this wild wheat was also found near Jiacha county, Gongga County and Longzi County in Shannan during this year's investigation. Currently known distribution areas include lancang River basin, Yarlung Zangbo River basin and Longzi River basin.
LU Jimei
")
Agriculture in Tibet is concentrated in the valleys of the Yarlung Zangbo River in south Tibet and the Nu, Lancang and Jinsha Rivers in east Tibet. The agricultural area of the valley accounts for 75 percent of the total cultivated land area of the autonomous region, and the grain output accounts for more than 80 percent of the total grain output of the autonomous region. Wheat and naked barley (known as highland barley in Tibet) are the main grain crops in The Tibet Autonomous Region, with the perennial sown area accounting for more than 80% of the total sown area, while the wheat and naked barley in the valley agricultural areas account for 75% of the sown area and 82% of the total yield of the region. The agricultural area of the valley is located between 28 ° and 31° north latitude, 2700 -- 4100 meters above sea level. It belongs to the temperate climate of the plateau, with better soil and water conservancy conditions and higher crop yield. But before liberation, under the dark feudal serfdom, the people lived in extreme poverty, and agricultural production was very backward, with the yield of grain per mu only over 100 jin. After liberation, especially since 1972, winter wheat was widely promoted in the agricultural areas of the valley, which promoted the reform of the farming system and significantly increased grain output. In 1975, the total grain output of the region increased by more than 50 percent compared with 1965, and by more than 1.5 times that of 1958 before the democratic reform. In 1977, the area sown with winter wheat was nearly 700,000 mu, accounting for about 20 percent of the grain sown area. The planting area of winter wheat has expanded from areas with an altitude of less than 3,000 meters to areas with an altitude of less than 4,100 meters, and the Tibetan Plateau has developed from a historical area of spring wheat into an area where both spring and winter wheat are grown. In 1977, the average yield of winter wheat per mu in the agricultural areas of the valley exceeded 400 jin, and that of bare barley and spring wheat also reached 300 jin per mu.
LU Jimei
")
Certain hydrothermal conditions and soil conditions are the basis of crop growth. The Tibetan Plateau covers a vast area, and the changes of altitude and surface form in different areas are extremely complex. Plateau climate and soil have obvious spatial changes, so the distribution of cultivated land and crops has a large regional. There are two groups of high mountain ranges running east-west and north-south in Tibet, forming the basic framework of the plateau. The vast plateau is distributed between the mountains, and there are many low mountains, hills, lake basins and valley inlaid in the meantime, the overall terrain of the whole region gradually picked up from the southeast to the northwest, the southeast is lower, the west, the north is higher. The majestic Himalayas stand on the southern and western borders of China and India, China and Nepal, China and Tin, China and Bhutan, and China and Pakistan. With a total length of 2,400 kilometers and a mountain width of 200-300 kilometers, and an average elevation of more than 6,000 meters, they constitute a natural barrier to the southern part of the Qinghai-Tibet Plateau. The warm and wet airflow in the Bay of Bengal is blocked by mountains. The climate on the southern slope of the Himalayas is warm and humid, while that on the northern foothills of the Himalayas is warm and cool and dry, forming two different climate regions on the southern and northern slopes. The south side of the Himalayas mountain rivers deep, mountain canyon landform. The valley is more than 3000 meters above sea level, and the climate is warm and humid. The soil types are rich, mainly including mountain yellow soil, mountain brown soil, mountain brown soil and mountain meadow soil, etc. The soil is acidic to neutral, and contains rich humus, high nitrogen content, coarse texture and good permeability. Abundant surface runoff, irrigation conditions are better. However, due to terrain limitations, most of the land cannot be used because the slope is greater than 25 degrees, and most of the land is covered by forests. Arable land is mainly distributed in the valley below 4000 meters, the area is very limited.
LU Jimei
")
The data set of economic, population, and urbanization growth and change in Qilian mountain area includes the social and economic development indicators of 1949-2020 long-term time series of 5 prefecture-level cities and 14 districts and counties in the Qilian mountain basin, such as the added value of the tertiary industry, population scale, etc. They are the subsets of economic, population, and urbanization growth changes of prefecture-level cities in Qilian mountain and the subsets of county-level economic, population, and urbanization growth changes in Qilian mountain. The data comes from Gansu statistical yearbook, Wuwei statistical bulletin of national economic and social development, Zhangye statistical bulletin of national economic and social development, Jiuquan statistical bulletin of national economic and social development, Jinchang statistical bulletin of national economic and social development, Jiayuguan statistical bulletin of national economic and social development, and social development of Ejina Banner. Since the data source is the publicly released provincial and Municipal Statistical Yearbook, the data has not been cross verified, and the consistency and accuracy of the data need to be verified in the process of data analysis and application. The data set is a macro data set reflecting the growth and change of economy, population, and urbanization in Qilian mountain. It has complete coverage and long-time series. It can provide basic information for the social and economic development and change of Qilian mountain.
WU Feng
")
This data set includes the social, economic, resource and other relevant index data of Gansu, Qinghai, Sichuan, Tibet, Xinjiang and Yunnan in the Qinghai Tibet Plateau from 2000 to 2015. The data are derived from Gansu statistical yearbook, Qinghai statistical yearbook, Sichuan statistical yearbook, Xizang statistical yearbook, Xinjiang statistical yearbook, Yunnan statistical Yearbook China county (city) socio economic statistical yearbook And China economic network, guotai'an, etc. The statistical scale is county-level unit scale, including 26 county-level units such as Yumen City, Aksai Kazak Autonomous Region and Subei Mongolian Autonomous County in Gansu Province, 41 county-level units such as Delingha City, Ulan county and Tianjun County in Qinghai Province, 46 counties such as Shiqu County, Ruoergai County and ABA County in Sichuan Province, and 78 counties such as Ritu County, Gaize county and bango County in Tibet, 14 counties including Wuqia County, aktao county and Shache County in Xinjiang Province, and 9 counties including Deqin County, Zhongdian county and Fugong County in Yunnan Province; Variables include County GDP, added value of primary industry, added value of secondary industry, added value of tertiary industry, total industrial output value of Industrial Enterprises above Designated Size, total retail sales of social consumer goods, balance of residents' savings deposits, grain output, total sown area of crops, number of students in ordinary middle schools and land area. The data set can be used to evaluate the social, economic and resource status of the Qinghai Tibet Plateau.
CHEN Yizhong
")
This dataset was captured during the field investigation of the Qinghai-Tibet Plateau in June 2021 using uav aerial photography. The data volume is 3.4 GB and includes more than 330 aerial photographs. The shooting locations mainly include roads, residential areas and their surrounding areas in Lhasa Nyingchi of Tibet, Dali and Nujiang of Yunnan province, Ganzi, Aba and Liangshan of Sichuan Province. These aerial photographs mainly reflect local land use/cover type, the distribution of facility agriculture land, vegetation coverage. Aerial photographs have spatial location information such as longitude, latitude and altitude, which can not only provide basic verification information for land use classification, but also provide reference for remote sensing image inversion of large-scale regional vegetation coverage by calculating vegetation coverage.
LV Changhe, ZHANG Zemin
")
The supply capacity of land resources is an important index to determine the carrying capacity of land resources. The data set includes: (1) the supply capacity of cultivated land resources in the Qinghai Tibet Plateau; (2) Data on grassland resource supply capacity of Qinghai Tibet Plateau. The supply capacity of cultivated land resources is based on the output of main agricultural products of Tibet Bureau of statistics, and summarizes the output of grain, meat, eggs and dairy livestock products at key nodes; The grassland resource supply capacity is based on the grassland area and livestock quantity data of Tibet Bureau of statistics, combined with field sampling data and climate data, and based on the aboveground biomass model to calculate the average biomass and total biomass of grassland in typical counties at key nodes. The data can be used to analyze the spatial difference of land supply capacity of the Qinghai Tibet Plateau, which is of great significance to the study of land carrying capacity of the Qinghai Tibet Plateau.
YANG Yanzhao

1) Data content: the data are the ancient DNA data generated by studying the cultural layer of Klu lding site in Nyingchi region, Tibetan Plateau, including the hiseqx metagenomics data of 10 ancient DNA samples from 4 layers. It can be used to preliminarily analyze the changes of species composition recorded by ancient DNA in the sediments, and reveal the process of local agricultural development. 2) Data source and processing method: the research group has its ownership. the data were obtained by using pair-end library building and Illumina hiseqx sequencing platform. 3) Data quality: 20.3 MB, Q30 > 85%. 4) Application: The data will be used to explore the potential of the ancient DNA from archaeological sediments in revealing the development of ancient agriculture on the Tibetan Plateau.
YANG Xiaoyan
")
The ecological resource consumption data set of Tibet includes the ecological resource consumption data of 2000-2019 at the provincial, city and county levels. According to the actual situation of Tibet, ecological resource consumption mainly refers to the amount of ecological resources consumed in agricultural and animal husbandry production activities. The calculation of ecological resource consumption is based on grain production data, livestock stock data and livestock product production data, combined with the evaluation method of human appropriation the net primary productivity (HANPP), convert biomass data into carbon content data, and then calculate the ecological resource consumption. Ecological resource consumption data is the basic data for the study of ecological pressure and ecological carrying capacity, which can directly reveal the pressure of human agricultural and animal husbandry production activities on the ecosystem.
YAN Huiming
")
The dataset recorded the output statistics of major crops in Qinghai province from 2007 to 2020, including wheat, highland barley, potato (fold grain), oil crops, wolfberry, vegetables and edible fungi, covering the period from 2007 to 2020. The dataset contains 13 data tables, which are: Crop yield (2007), crop yield (2008), crop yield (2009), crop yield (2010), crop yield (2011), crop yield (2012), crop yield (2013), crop yield (2014), crop yield (2015), Crop output (2016), crop output (2017), crop output (2018) Output of major crop products in Qinghai Province (2015-2020).xls. The data table structure is similar. For example, the crop yield (2007) data table has 4 fields: Field 1: Indicator name Field 2: Year 2006 Field 3: Year 2007 Field 4: increase or decrease
AGRICULTURAL AND RURAL Department of Qinghai Province
")
The data set records the situation of breeding livestock and poultry farms and stations in Qinghai Province, and the statistical data covers the period from 2009 to 2018. The data are divided by cattle breeding farm, horse breeding farm, pig breeding farm, sheep breeding farm, poultry breeding farm, rabbit breeding farm, bee breeding farm and others. The data set contains 10 data tables, which are: breeding livestock and poultry stations (2009), breeding livestock and poultry stations (2010), breeding livestock and poultry stations (2011), breeding livestock and poultry stations (2012), breeding livestock and poultry stations (2013), breeding livestock and poultry stations (2014), breeding livestock and poultry stations (2015), breeding livestock and poultry stations (2016), breeding livestock and poultry stations (2017), Breeding livestock and poultry farms and stations (2018). The data table structure is similar. For example, there are 7 fields in the data sheet of breeding livestock and poultry farms and stations (2009): Field 1: indicator name Field 2: number of fields Field 3: year end inventory Field 4: breeding stock Field 5: breeding livestock and poultry in the current year Field 6: embryos produced in the current year Field 7: Semen produced in the current year
AGRICULTURAL AND RURAL Department of Qinghai Province
")
The data set records the effective use of organic product mark certification units and products in Qinghai Province. The statistical data covers the period from 2009 to 2016. The data are divided by Qinghai CommScope Biotechnology Co., Ltd., Qinghai Tsinghua Bozhong Biotechnology Co., Ltd., Qinghai Datong cattle breeding farm, Qinghai Haixi aquaculture farm, Henan Sanyuan Mengxin organic livestock product development company and other projects. The data set contains 8 data tables, which are: the effective use of organic product mark certification units and products in Qinghai Province (2014), the effective use of organic product mark certification units and products in Qinghai Province (2015), and the effective use of organic product mark certification units and products in Qinghai Province (2016), List of publicity on the effective use of organic product mark certification units and products in Qinghai Province (2013), list of effective use of organic product mark certification enterprises and products in Qinghai Province (2009), list of effective use of organic product mark certification enterprises and products in Qinghai Province (2010), List of enterprises and products effectively using organic product mark certification in Qinghai Province (2011), and list of enterprises and products effectively using organic product mark certification in Qinghai Province (2012). The data table structure is similar. For example, there are 7 fields in the data sheet of the list of enterprises and products effectively using organic product mark certification in Qinghai Province (2010): Field 1: Manufacturer Field 2: industry name Field 3: Certificate number Field 4: registered trademark Field 5: Production Field 6: product sales region Field 7: contact number
AGRICULTURAL AND RURAL Department of Qinghai Province
")
The data set records the basic situation data of Township animal husbandry and veterinary extension institutions in Qinghai Province, and the statistical data covers the period from 2012 to 2017. The data are divided according to the number of stations, total number of employees, Technical Title Status, operation status, annual total income, annual total expenditure and other items. The data set contains five data tables, which are: basic information of Township animal husbandry and veterinary extension institutions (2012), basic information of Township animal husbandry and veterinary extension institutions (2014), basic information of Township animal husbandry and veterinary extension institutions (2015), basic information of Township animal husbandry and veterinary extension institutions (2016) and basic information of Township animal husbandry and veterinary extension institutions (2017). The data table structure is similar. For example, the data sheet of basic information of Township animal husbandry and veterinary extension institutions (2012) has three fields: Field 1: indicator name Field 2: Calculation Field 3: quantity
AGRICULTURAL AND RURAL Department of Qinghai Province
")
This data set records the statistical data of origin identification and product certification of pollution-free agricultural products in Qinghai Province, covering the period from 2009 to 2017. The data are divided by items such as Huzhu County Vegetable Technology Service Center, Qinghai mutual Feng Agricultural Technology Co., Ltd., Wulan County Agricultural Technology Extension Station of Haixi Prefecture, Dulan County Agricultural Technology Extension Station, Ledu County Vegetable Technology Extension Center, Datong County Vegetable workstation, etc. The data set contains 9 data tables, which are: list of origin identification and product certification of pollution-free agricultural products in Qinghai Province (2009), list of origin identification and product certification of pollution-free agricultural products in Qinghai Province (2010), list of origin identification and product certification of pollution-free agricultural products in Qinghai Province (2011), List of origin identification and product certification of pollution-free agricultural products in Qinghai Province (2012), list of origin identification and product certification of pollution-free agricultural products in Qinghai Province (2013), list of origin identification and product certification of pollution-free agricultural products in Qinghai Province (2014), list of origin identification and product certification of pollution-free agricultural products in Qinghai Province (2015), List of origin identification and product certification of pollution-free agricultural products in Qinghai Province (2016), and list of origin identification and product certification of pollution-free agricultural products in Qinghai Province (2017). The data table structure is similar. For example, there are 6 fields in the data sheet of origin identification and product certification of pollution-free agricultural products in Qinghai Province (2009): Field 1: production unit Field 2: origin address Field 3: product name Field 4: origin scale Field 5: annual production Field 6: Certificate of origin number (validity period)
AGRICULTURAL AND RURAL Department of Qinghai Province
")
The data set records the statistical data of grain and oil crop production in Qinghai Province, covering the period from 2013 to 2018. The data are divided by Xining City, Haidong City, Huangnan Prefecture, Haibei Prefecture, Hainan prefecture, Haixi Prefecture, Guoluo Prefecture, Yushu prefecture, prison bureau, Sanjiangyuan and other projects. The data set contains six data tables, which are: Provincial Grain and oil crop production statistics (2013), provincial grain and oil crop production statistics (2014), provincial grain and oil crop production statistics (2015), provincial grain and oil crop production statistics (2016), provincial grain and oil crop production statistics (2017) and provincial grain and oil crop production statistics (2018). The data table structure is similar. For example, there are 8 fields in the statistical table of grain and oil crop production of the whole province (2013): Field 1: Wheat Field 2: highland barley Field 3: broad bean Field 4: Peas Field 5: Potato Field 6: Corn Field 7: Rapeseed Field 8: Flax
AGRICULTURAL AND RURAL Department of Qinghai Province
")
The data set records the statistical data of grain and oil crop sowing area in Qinghai Province, covering the period from 2015 to 2018. The data are divided by Xining City, Haidong City, Huangnan Prefecture, Hainan prefecture and other projects. The data set contains four data tables, which are: Statistics of grain and oil crop area of the whole province (2015), statistics of grain and oil crop area of the whole province (2016), statistics of grain and oil crop area of the whole province (2017) and statistics of grain and oil crop area of the whole province (2018). The data table structure is similar. For example, the statistical data sheet of grain and oil crop area in the province (2015) has three fields: Field 1: food crops Field 2: oil crops Field 3: other crops
AGRICULTURAL AND RURAL Department of Qinghai Province
")
The data set recorded the statistical data of crop sown area in Qinghai Province, covering the period from 1978 to 2020. Data is broken down by major years. The dataset contains 13 data tables, which are: Sown area of crops (2006), sown area of crops (2007), sown area of crops (2008), sown area of crops (2009), sown area of crops (2010), sown area of crops (2011), sown area of crops (2012), sown area of crops (2012), sown area of crops (2012), The sown area of crops (2013), the sown area of crops (2014), the sown area of crops (2015), the sown area of crops (2016), the sown area of crops (2017), the sown area of crops (2018), the sown area of crops (1978-2020). The data table structure is similar. For example, the sown area of crops (1978-2020) data table has 5 fields: Field 1: Year Field 2: Food crops Field 3: Wheat Field 4: miscellaneous grains Field 5: Roots
AGRICULTURAL AND RURAL Department of Qinghai Province
")
This data set records the statistical data of agricultural and animal husbandry scientific and technological talent resources in Qinghai Province, covering the period from 2011 to 2016. The data are divided by animal husbandry and veterinary, planting, fishery, agricultural machinery, land reclamation and other projects. The data set contains six data tables, which are: Statistics of scientific and technological human resources in agriculture and animal husbandry (applicable to extension institutions) (2011), statistics of scientific and technological human resources in agriculture and animal husbandry (applicable to extension institutions) (2012), statistics of scientific and technological human resources in agriculture and animal husbandry (applicable to extension institutions) (2013), statistics of scientific and technological human resources in agriculture and animal husbandry (applicable to extension institutions) (2014), Statistics of agricultural and animal husbandry scientific and technological human resources (applicable to extension institutions) (2015), statistics of agricultural and animal husbandry scientific and technological human resources (applicable to extension institutions) (2016). The data table structure is similar. For example, the statistical table of agricultural and animal husbandry scientific and technological talent resources (applicable to extension institutions) (2011) has five fields: Field 1: number of employees at the end of the year Field 2: number of scientific and technological talents Field 3: Qualification Field 4: Education Field 5: Gender
AGRICULTURAL AND RURAL Department of Qinghai Province
")
The data set records the statistical data of comprehensive production conditions in agricultural and pastoral areas of Qinghai Province, covering the period from 2014 to 2018. The data are divided into 8 states, cities and 43 counties and districts according to Xining City, Haidong region, Haibei Prefecture, Huangnan Prefecture, Hainan prefecture, Guoluo Prefecture, Yushu prefecture and Haixi Prefecture. The data set contains 51 data tables, which are: production conditions in agricultural and pastoral areas (Table 1) (2014), production conditions in agricultural and pastoral areas (Table 2) (2014), production conditions in agricultural and pastoral areas (Table 3) (2014), production conditions in agricultural and pastoral areas (table 4) (2014), production conditions in agricultural and pastoral areas (Table 5) (2014), production conditions in agricultural and pastoral areas (Table 6) (2014), Production conditions in agricultural and pastoral areas (Table 7) (2014), production conditions in agricultural and pastoral areas (Table 8) (2014), production conditions in agricultural and pastoral areas (Table 9) (2014), production conditions in agricultural and pastoral areas (table 10) (2014), etc. The data table structure is similar. For example, the data sheet of production conditions in agricultural and pastoral areas (Table I) (2014) has four fields: Field 1: total rural labor resources Field 2: grouping by gender Field 3: total number of rural employees Field 4: grouping by educational level, etc
AGRICULTURAL AND RURAL Department of Qinghai Province
")
The data set records the agricultural production conditions in agricultural and pastoral areas of Qinghai Province, including agricultural mechanization, farmland water conservancy, mechanization project level, natural disasters, etc. The statistical data covers the period from 2014 to 2018. The data are divided into 8 states, cities and 43 counties and districts according to Xining City, Haidong region, Haibei Prefecture, Huangnan Prefecture, Hainan prefecture, Guoluo Prefecture, Yushu prefecture and Haixi Prefecture. The data set contains five data tables: agricultural production conditions in agricultural and pastoral areas (2014), agricultural production conditions in agricultural and pastoral areas (2015), agricultural production conditions in agricultural and pastoral areas (2016), agricultural production conditions in agricultural and pastoral areas (2017) and agricultural production conditions in agricultural and pastoral areas (2018). The data table has the same structure. For example, the data table of agricultural production conditions in agricultural and pastoral areas (2014) has 6 fields: Field 1: rainwater collection cellar Field 2: water saving irrigation machinery Field 3: agricultural water pumps Field 4: Combine Field 5: self propelled motorized windrower Field 6: motorized thresher
AGRICULTURAL AND RURAL Department of Qinghai Province
")
The data set records the basic situation of agricultural and pastoral areas in Qinghai Province, including the number of townships, villagers' committees, community infrastructure, etc. the statistical data covers the period from 2014 to 2018. The data are divided into 8 states, cities and 43 counties and districts according to Xining City, Haidong region, Haibei Prefecture, Huangnan Prefecture, Hainan prefecture, Guoluo Prefecture, Yushu prefecture and Haixi Prefecture. The data set contains 10 data tables, which are: basic information of agricultural and pastoral areas (Table 1) (2014), basic information of agricultural and pastoral areas (Table 2) (2014), basic information of agricultural and pastoral areas (Table 1) (2015), basic information of agricultural and pastoral areas (table 2) (2015), basic information of agricultural and pastoral areas (Table 1) (2016), basic information of agricultural and pastoral areas (Table 2) (2016), Basic information of agricultural and pastoral areas (Table 1) (2017), basic information of agricultural and pastoral areas (Table 2) (2017), basic information of agricultural and pastoral areas (Table 1) (2018), basic information of agricultural and pastoral areas (Table 2) (2018). The data table structure is similar. For example, the basic information of agricultural and pastoral areas (Table I) (2014) data table has three fields: Field 1: number of villages and towns Field 2: Village Committee (PCs.) Field 3: rural community infrastructure (PCs.)
AGRICULTURAL AND RURAL Department of Qinghai Province
 (2006-2014)")
The data set records the total output value and added value of agriculture, forestry, animal husbandry and fishery in Qinghai Province at current price. The statistical data covers the period from 2006 to 2014. The data are divided by total output value of agriculture, forestry, animal husbandry and fishery, agriculture, forestry, animal husbandry, fishery, agriculture, forestry, animal husbandry and fishery services, etc. The data set contains 9 data tables, which are: total output value and added value of agriculture, forestry, animal husbandry and fishery (current price) (2006), total output value and added value of agriculture, forestry, animal husbandry and fishery (current price) (2007), total output value and added value of agriculture, forestry, animal husbandry and fishery (current price) (2008), total output value and added value of agriculture, forestry, animal husbandry and fishery (current price) (2009), total output value and added value of agriculture, forestry, animal husbandry and fishery (current price) (2010), total output value and added value of agriculture, forestry, animal husbandry and fishery (current price) (2011), total output value and added value of agriculture, forestry, animal husbandry and fishery (current price) (2012), total output value and added value of agriculture, forestry, animal husbandry and fishery (current price) (2013), total output value and added value of agriculture, forestry, animal husbandry and fishery (current price) (2014). The data table structure is similar. For example, the data table of total output value and added value (current price) (2006) of agriculture, forestry, animal husbandry and fishery has four fields: Field 1: indicator name Field 2: 2006 Field 3: 2005 Field 4: increase or decrease%
AGRICULTURAL AND RURAL Department of Qinghai Province
")
The data set records the basic statistics of agricultural reclamation enterprises and institutions in Qinghai Province, covering the period from 2004 to 2006. According to the data of Haixi Agricultural Reclamation Bureau, Delingha farm, bayinhe farm, Gahai farm, huaitoutara farm, chachachaxiangka farm, Mohe ranch, Dulan camel farm, Golmud farm, Qinghai Lake farm, Tongbao ranch and Topaz ranch, there are 19 farms in total. The data set is provided by the Department of agriculture and animal husbandry of Qinghai Province. The data set includes: basic information of agricultural reclamation enterprises and institutions (Table 1) (2004), basic information of agricultural reclamation enterprises and institutions (Table 2) (2004), basic information of agricultural reclamation enterprises and institutions (Table 3) (2004), basic information of agricultural reclamation enterprises and institutions (Table 4) (2004), basic information of agricultural reclamation enterprises and institutions (Table 5) (2004), basic information of agricultural reclamation enterprises and institutions (2005), Basic information of agricultural reclamation enterprises and institutions (Table I) (2005) and other 18 data tables in total. The data tables have similar structures. For example, the basic information of agricultural reclamation enterprises and institutions (Table I) (2004) has five fields: Field 1: enterprise name Field 2: enterprise nature Field 3: competent department Field 4: main industry Field 5: output value (10000 yuan), etc
AGRICULTURAL AND RURAL Department of Qinghai Province
")
The data set records the basic situation of rural areas and agricultural production conditions in Qinghai Province. The statistical data covers the period from 2007 to 2013. The data are divided into 8 states, cities and 43 counties and districts according to Xining City, Haidong region, Haibei Prefecture, Huangnan Prefecture, Hainan prefecture, Guoluo Prefecture, Yushu prefecture and Haixi Prefecture. The data set includes rural basic situation and agricultural production conditions (Table 1) (2007), rural basic situation and agricultural production conditions (Table 2) (2007), rural basic situation and agricultural production conditions (Table 3) (2007), rural basic situation and agricultural production conditions (Table 4) (2007), rural basic situation and agricultural production conditions (Table 5) (2007), rural basic situation and agricultural production conditions (Table 6) (2007), rural basic situation and agricultural production conditions (Table 7) (2007), rural basic situation and agricultural production conditions (Table 8) (2007), rural basic situation and agricultural production conditions (Table 1) (2008), rural basic situation and agricultural production conditions (Table 2) There are 105 data sheets in total (2008). The structures of each data sheet are similar. For example, the data sheet of rural basic situation and agricultural production conditions (Table I) (2007) has 20 fields: Field 1: number of township governments Field 2: number of village committees Field 3: number of cooperatives Field 4: number of rural households Field 5: rural population Field 6: rural community infrastructure Field 7: total rural labor resources Field 8: total number of rural employees Field 9: current year outgoing personnel Field 10: education level Field 11: agriculture, forestry, animal husbandry and fishery practitioners Field 12: total cultivated land resources at the beginning of the year Field 13: cultivated land area increased in the current year Field 14: cultivated land area reduced in the current year Field 15: national infrastructure land occupation Field 16: land occupation of rural collective infrastructure Field 17: land occupied by individual farmers Field 18: Reforestation area Field 19: area for returning farmland to grassland Field 20: change cultivated land to garden land
AGRICULTURAL AND RURAL Department of Qinghai Province
")
The data set records the basic situation of rural areas in Qinghai Province, including rural households, rural population and other information. The statistical data covers the period from 2014 to 2018. The data are divided into 8 states, cities and 43 counties and districts according to Xining City, Haidong region, Haibei Prefecture, Huangnan Prefecture, Hainan prefecture, Guoluo Prefecture, Yushu prefecture and Haixi Prefecture. The data set contains five data tables, which are: basic rural situation (2014), basic rural situation (2015), basic rural situation (2016), basic rural situation (2017) and basic rural situation (2018). The structures of each data table are similar. For example, the basic rural situation (2014) data sheet has two fields: Field 1: number of rural households Field 2: rural population
AGRICULTURAL AND RURAL Department of Qinghai Province
")
The data set records the basic situation of leading enterprises in agriculture and animal husbandry industrialization in Qinghai Province, and the statistical data covers the period from 2013 to 2018. The data is divided by enterprise name, enterprise registration type, legal representative, general manager, enterprise address, fixed telephone, mobile phone and fax. The data set contains six data tables, which are: basic information table of leading enterprises in agriculture and animal husbandry industrialization in Qinghai Province (2013), basic information table of leading enterprises in agriculture and animal husbandry industrialization in Qinghai Province (2014), basic information table of leading enterprises in agriculture and animal husbandry industrialization in Qinghai Province (2015), basic information table of leading enterprises in agriculture and animal husbandry industrialization in Qinghai Province (2016), Basic information of leading enterprises in agriculture and animal husbandry industrialization in Qinghai Province (2017), and basic information of leading enterprises in agriculture and animal husbandry industrialization in Qinghai Province (2018). The data table structure is the same. For example, the basic information table of leading enterprises in agriculture and animal husbandry industrialization in Qinghai Province (2013) has 9 fields: Field 1: enterprise name Field 2: enterprise registration type Field 3: legal representative Field 4: General Manager Field 5: business address Field 6: zip code Field 7: fixed telephone, mobile phone and fax Field 8: Web address Field 9: remarks
AGRICULTURAL AND RURAL Department of Qinghai Province
")
The data set records the animal husbandry production in pastoral and semi pastoral counties of Qinghai Province. The statistical data covers the period from 2009 to 2018. The data are divided according to the basic situation, livestock and poultry breeding, output and marketing of livestock products, sales of livestock products and other items. The data set contains 10 data tables, which are: animal husbandry production in pastoral counties and semi pastoral counties (2009), animal husbandry production in pastoral counties and semi pastoral counties (2010), animal husbandry production in pastoral counties and semi pastoral counties (2011), animal husbandry production in pastoral counties and semi pastoral counties (2012), animal husbandry production in pastoral counties and semi pastoral counties (2013), pastoral counties Animal husbandry production in semi pastoral counties (2014), animal husbandry production in pastoral counties and semi pastoral counties (2015), animal husbandry production in pastoral counties and semi pastoral counties (2016), animal husbandry production in pastoral counties and semi pastoral counties (2017), and animal husbandry production in pastoral counties and semi pastoral counties (2018). The data table structure is similar. For example, there are four fields in the data sheet of animal husbandry production in pastoral counties and semi pastoral counties (2010): Field 1: indicator name Field 2: calculation unit Field 3: Pastoral County Field 4: semi pastoral counties
AGRICULTURAL AND RURAL Department of Qinghai Province
")
The data set records the planting area and output of grain, oil and vegetables in different counties of Qinghai Province. The statistical data covers the period from 2005 to 2009. The data are divided by Xining City, Hainan prefecture, Guoluo Prefecture, Haixi Prefecture and other projects. The data set includes: area and output of grain, oil and vegetables by county (Table 1) (2005), area and output of grain, oil and vegetables by county (Table 2) (2005), area and output of grain, oil and vegetables by county (Table 3) (2005), area and output of grain, oil and vegetables by county (Table 4) (2005), area and output of grain, oil and vegetables by county (Table 5) (2005) There are 44 data tables in total, including the area and output of grain, oil and vegetables by county (Table 6) (2005), the area and output of grain, oil and vegetables by county (Table 7) (2005), the area and output of grain, oil and vegetables by county (Table 8) (2005), and the area and output of grain, oil and vegetables by county (Table 9) (2005). The data table structure is similar. For example, the area and output of grain, oil and vegetables by county (table 10), (2006), the data table has 7 fields: Field 1: Project Field 2: sown area of other crops Field 3: green feed Field 4: oats Field 5: green manure Field 6: Flowers Field 7: other
AGRICULTURAL AND RURAL Department of Qinghai Province
")
The data set records the output and production of livestock products in different counties of Qinghai Province, and the statistical data covers the period from 2008 to 2018. The data are divided into 8 states and cities according to Xining City, Haidong region, Haibei Prefecture, Huangnan Prefecture, Hainan prefecture, Guoluo Prefecture, Yushu prefecture and Haixi Prefecture. The data set contains 9 data tables, which are: production of livestock products by county (2008), production of livestock products by county (2009), production of livestock products by county (2012), production of livestock products by county (2013), production of livestock products by county (2014) and production of livestock products by county (2015) , the output and production of livestock products by county (2016), the output and production of livestock products by county (2017) and the output and production of livestock products by county (2018) are similar in structure. For example, there are 18 fields in the table of livestock production by county (2015): Field 1: county name Field 2: total meat production Field 3: where: beef Field 4: pork Field 5: mutton Field 6: Poultry Field 7: rabbit meat Field 8: milk production Field 9: milk production Field 10: where: yak milk production Field 11: cashmere production Field 12: goat wool production Field 13: sheep wool production Field 14: where: fine wool production Field 15: semi fine wool production Field 16: honey production Field 17: egg production Field 18: where: egg production
AGRICULTURAL AND RURAL Department of Qinghai Province
")
The data set records the animal husbandry indicators of Qinghai Province, and the statistical data covers the period from 2006 to 2014. The data are divided according to the survival rate of young animals, mortality rate of adult and young animals, reproductive survival rate, slaughter rate of meat animals, commodity rate of livestock, total growth rate of livestock, etc. The data set contains 8 data tables, namely: animal husbandry index (2006), animal husbandry index (2007), animal husbandry index (2009), animal husbandry index (2010), animal husbandry index (2011), animal husbandry index (2012), animal husbandry index (2013) and animal husbandry index (2014). The data table structure is similar. For example, the data sheet of animal husbandry indicators (2011) has four fields: Field 1: indicator name Field 2: 2010 Field 3: 2011 Field 4: increase or decrease%
AGRICULTURAL AND RURAL Department of Qinghai Province
")
The data set recorded the statistical data of animal husbandry production in Qinghai Province, covering the period from 2004 to 2020. Data are divided by livestock, pigs, sheep, poultry, rabbits, bees and other items. The dataset contains 16 data tables, which are: Animal Husbandry Production (2006), Animal Husbandry production (2007), Animal husbandry production (2010), Animal husbandry production (2011), Animal husbandry production (2014), Animal husbandry production (2015), Animal husbandry production (2016), Animal husbandry production (2017), Animal Husbandry Production (2018), Animal Husbandry Production (Table II) (2004), Animal Husbandry Production (Table II) (2005), Animal Husbandry production (Table III) (2004), Animal Husbandry Production (Table I) (2004), Animal Husbandry Production (Table I) (2005), Qinghai Animal Husbandry Production and Output of Main Animal Products (2014-2019). XLS, Qinghai Animal Husbandry Production and Output of Main Animal Products (2015-2020). XLS. The data table structure is similar. For example, the livestock Production Table (2006) has five fields: Field 1: Item Field 2: Final number of stocks Field 3: Can breed females Field 4: Year of birth Field 5: Number of bars in the current year
AGRICULTURAL AND RURAL Department of Qinghai Province
")
The data set records the statistical data of "breeding in the West and breeding in the East" in Qinghai Province, covering the period from 2003 to 2005. The data are divided into 12 counties such as Huangzhong County, Huangyuan County, Datong County, Ping'an County, Xunhua County, Hualong County, Huzhu County, Tongren County and Ledu County, and 14 related reference years such as 2003 and 2004. The data set contains two data tables, namely, "West breeding and East breeding" table (2003-2004) and "West breeding and East breeding" table (2004-2005). The data table structure is similar. For example, the data table of "breeding in the West and breeding in the East" (2004-2005) has five fields: Field 1: Unit Field 2: total number of households Field 3: cattle and sheep fattening Field 4: Loan Status Field 5: fattening stock
AGRICULTURAL AND RURAL Department of Qinghai Province
")
This data set records the statistical data on the production of animal husbandry counties in Qinghai Province in the current year, covering the period from 2008 to 2018. The data are divided into 8 states, cities and 43 counties and districts according to Xining City, Haidong region, Haibei Prefecture, Huangnan Prefecture, Hainan prefecture, Guoluo Prefecture, Yushu prefecture and Haixi Prefecture. The data set contains 11 data tables, which are: the production situation of animal husbandry counties in the current year (2008), the production situation of animal husbandry counties in the current year (2009), the production situation of animal husbandry counties in the current year (2010), the production situation of animal husbandry counties in the current year (2011), and the production situation of animal husbandry counties in the current year (2012), Production situation of animal husbandry counties in the current year (2013), production situation of animal husbandry counties in the current year (2014), production situation of animal husbandry counties in the current year (2015), production situation of animal husbandry counties in the current year (2016), production situation of animal husbandry counties in the current year (2017), and production situation of animal husbandry counties in the current year (2018). The data table structure is similar. For example, there are five fields in the data sheet of the production situation of animal husbandry counties in the current year (2008): Field 1: large livestock Field 2: Pig Field 3: sheep Field 4: Poultry Field 5: Rabbit
AGRICULTURAL AND RURAL Department of Qinghai Province
")
The data set records the statistical data on the production of fertile female animals in animal husbandry counties of Qinghai Province, covering the period from 2008 to 2018. The data are divided into 8 states, cities and 43 counties and districts according to Xining City, Haidong region, Haibei Prefecture, Huangnan Prefecture, Hainan prefecture, Guoluo Prefecture, Yushu prefecture and Haixi Prefecture. The data set contains 11 data tables, which are: production of fertile female livestock in animal husbandry counties (2008), production of fertile female livestock in animal husbandry counties (2009), production of fertile female livestock in animal husbandry counties (2010), production of fertile female livestock in animal husbandry counties (2011) and production of fertile female livestock in animal husbandry counties (2012) , production of fertile female livestock in animal husbandry counties (2013), production of fertile female livestock in animal husbandry counties (2014), production of fertile female livestock in animal husbandry counties (2015), production of fertile female livestock in animal husbandry counties (2016), production of fertile female livestock in animal husbandry counties (2017) and production of fertile female livestock in animal husbandry counties (2018) . the data table structure is similar. For example, the data table has three fields: Field 1: large livestock Field 2: Pig Field 3: sheep
AGRICULTURAL AND RURAL Department of Qinghai Province
")
The data set records the statistical data of meat production in animal husbandry counties in Qinghai Province, covering the period from 2008 to 2018. The data are divided into 8 states, cities and 43 counties and districts according to Xining City, Haidong region, Haibei Prefecture, Huangnan Prefecture, Hainan prefecture, Guoluo Prefecture, Yushu prefecture and Haixi Prefecture. The data set contains 11 data tables, which are: meat production by County in animal husbandry (2008), meat production by County in animal husbandry (2009), meat production by County in animal husbandry (2010), meat production by County in animal husbandry (2012), meat production by County in animal husbandry (2013), meat production by County in animal husbandry (2014), Table of meat production by County in animal husbandry (2015), table of meat production by County in animal husbandry (2016), table of meat production by County in animal husbandry (2017), table of meat production by County in animal husbandry (2018). The data table structure is similar. For example, the data sheet of meat production by County in animal husbandry (2008) has five fields: Field 1: large livestock Field 2: Pig Field 3: sheep Field 4: Poultry Field 5: Rabbit
AGRICULTURAL AND RURAL Department of Qinghai Province
")
The data set records the statistical data of stock production at the end of the period by county of animal husbandry in Qinghai Province, covering the period from 2008 to 2018. The data are divided into 8 states, cities and 43 counties and districts according to Xining City, Haidong region, Haibei Prefecture, Huangnan Prefecture, Hainan prefecture, Guoluo Prefecture, Yushu prefecture and Haixi Prefecture. The data set contains 14 data tables, which are: livestock production by county at the end of the period (2008), livestock production by county at the end of the period (2009), livestock production by county at the end of the period (2010), livestock production by county at the end of the period (2011) (Table 1), and livestock production by county at the end of the period (2011) (Table 2), livestock production by county at the end of the period (2012), livestock production by county at the end of the period (2013), livestock production by county at the end of the period (2014), livestock production by county at the end of the period (2015), livestock production by County at the end of the period (2016), and livestock production by county at the end of the period (2017), livestock production by county at the end of the period (2018). The data table structure is similar. For example, the data table of livestock production by county at the end of the period (2008) has 6 fields: Field 1: large livestock Field 2: Pig Field 3: sheep Field 4: Poultry Field 5: Rabbit Field 6: bees
AGRICULTURAL AND RURAL Department of Qinghai Province
")
The data set records the statistical data of animal husbandry production and economic benefit indicators in Qinghai Province, covering the period from 2004 to 2006. The data are divided by the number of female animals that failed to reproduce in the year, the number of live piglets in the year, the total growth rate of livestock, the slaughter rate of livestock, the reproduction rate of female animals, the reproduction survival rate of female animals, etc. The data set contains 9 data tables, which are respectively: animal husbandry production and economic benefit indicators (Table 1) (2004), animal husbandry production and economic benefit indicators (Table 2) (2004), animal husbandry production and economic benefit indicators (Table 3) (2004), animal husbandry production and economic benefit indicators (Table 1) (2005) and animal husbandry production and economic benefit indicators (Table 2) (2005), animal husbandry production and economic benefit indicators (Table 3) (2005), animal husbandry production and economic benefit indicators (Table 1) (2006), animal husbandry production and economic benefit indicators (Table 2) (2006), animal husbandry production and economic benefit indicators (Table 3) (2006). The data table structure is similar. For example, animal husbandry production and economic benefit indicators (Table 1) The data sheet (2004) has three fields: Field 1: indicator Field 2: Units Field 3: year
AGRICULTURAL AND RURAL Department of Qinghai Province
")
The data set records the statistical data of natural grassland grade area in Zhiduo County, Qinghai Province in 1988 and 2012. The data are classified and counted according to the grade code of natural grassland. The grassland is divided into five grades: excellent, good, medium, low and poor with grassland type as the basic unit. The classification criteria of each grade are as follows: Grade I (excellent) Grassland: the weight of excellent forage accounts for more than 60%; Grade II (good grade) Grassland: the weight of grass above good grade accounts for more than 60%, and that of other types accounts for 40%; Grade III (medium) Grassland: the weight of forages above the medium category accounts for more than 60%, and that of other categories accounts for 40%; Grade IV (low) Grassland: the weight of grass above the low category accounts for more than 60%, and that of other categories accounts for 40%; Grade V (inferior) Grassland: the weight of inferior forage accounts for more than 40% The grassland level is divided into 8 levels according to the fresh grass yield. Standards at all levels are as follows: Level 1 Grassland: more than 12000k g of fresh grass per hectare of grassland; Level 2 Grassland: 9000kg ~ 12000kg fresh grass per hectare; Level 3 Grassland: 6000kg ~ 9000kg fresh grass per hectare; Level 4 Grassland: 4500kg ~ 6000kg fresh grass per hectare; Level 5 Grassland: 30001kg ~ 4500kg fresh grass per hectare; Grade 6 Grassland: 1500kg ~ 3000kg fresh grass per hectare; Grade 7 Grassland: 750KG ~ 1500kg fresh grass per hectare; Grade 8 Grassland: fresh grass per hectare is less than 750KG. The data are compiled from the grassland station of Qinghai Province and the grassland resources statistics of Qinghai Province issued in 1988 and 2012. The data set contains two data tables, namely: Statistics of natural grassland grade area in Zhiduo county (2012) and statistics of natural grassland grade in Zhiduo county (1988). The data table structure is similar. For example, the statistical data of natural grassland grade area in Zhiduo county (2012) has 9 fields: Field 1: Total Field 2: Level 1 Field 3: Level 2 Field 4: Level 3 Field 5: Level 4 Field 6: Level 5 Field 7:6 level Field 8: Level 7 Field 9: level 8
AGRICULTURAL AND RURAL Department of Qinghai Province
")
The data set records the statistical data of grassland type area and livestock carrying capacity in Zhiduo County, Qinghai Province in 1988 and 2012. The data are classified and counted according to the grassland group code, such as: I represents Alpine dry grassland, II represents mountain dry grassland, III represents Alpine desert, B represents medium grass group, J represents shrub group, etc, For specific grassland group type codes and their corresponding meanings, see "description of grassland group type codes in Qinghai Province. PDF" in the data set. The data are compiled from the grassland station of Qinghai Province and the grassland resources statistics of Qinghai Province issued in 1988 and 2012. The data set contains three data tables, which are: description of grassland group code in Qinghai Province, grassland type area and livestock carrying capacity statistics of Zhiduo county (1988), and grassland type area and livestock carrying capacity statistics of Zhiduo county (2012). The data table structure is similar. For example, there are 8 fields in the statistical data (2012) of grassland type area and livestock carrying capacity in Zhiduo County: Field 1: type code Field 2: grassland type name Field 3: grassland area Field 4: available area of grassland Field 5: average unit yield of fresh grass Field 6: average unit yield of edible fresh grass Field 7: stocking capacity Field 8: grassland type grade
AGRICULTURAL AND RURAL Department of Qinghai Province
")
The data set records the statistical data of natural grassland grade area in Zeku County, Qinghai Province in 1988 and 2012. The data are classified and counted according to the grade code of natural grassland. The grassland is divided into five grades: excellent, good, medium, low and poor based on the grassland type. The classification criteria of each grade are as follows: Grade I (excellent) Grassland: the weight of excellent forage accounts for more than 60%; Grade II (good grade) Grassland: the weight of grass above good grade accounts for more than 60%, and that of other types accounts for 40%; Grade III (medium) Grassland: the weight of forages above the medium category accounts for more than 60%, and that of other categories accounts for 40%; Grade IV (low) Grassland: the weight of grass above the low category accounts for more than 60%, and that of other categories accounts for 40%; Grade V (inferior) Grassland: the weight of inferior forage accounts for more than 40% The grassland level is divided into 8 levels according to the fresh grass yield. Standards at all levels are as follows: Level 1 Grassland: more than 12000k g of fresh grass per hectare of grassland; Level 2 Grassland: 9000kg ~ 12000kg fresh grass per hectare; Level 3 Grassland: 6000kg ~ 9000kg fresh grass per hectare; Level 4 Grassland: 4500kg ~ 6000kg fresh grass per hectare; Level 5 Grassland: 30001kg ~ 4500kg fresh grass per hectare; Grade 6 Grassland: 1500kg ~ 3000kg fresh grass per hectare; Grade 7 Grassland: 750KG ~ 1500kg fresh grass per hectare; Grade 8 Grassland: fresh grass per hectare is less than 750KG. The data are compiled from the grassland station of Qinghai Province and the grassland resources statistics of Qinghai Province issued in 1988 and 2012. The data set contains two data tables: statistical data of natural grassland grade area in Zeku County (2012) and statistical data of natural grassland grade in Zeku County (1988). The data table structure is similar. For example, the statistical data of natural grassland grade area in Zeku County (2012) has 9 fields: Field 1: Total Field 2: Level 1 Field 3: Level 2 Field 4: Level 3 Field 5: Level 4 Field 6: Level 5 Field 7:6 level Field 8: Level 7 Field 9: level 8
AGRICULTURAL AND RURAL Department of Qinghai Province
")
The data set records the statistical data of grassland type area and livestock carrying capacity in Zeku County, Qinghai Province in 1988 and 2012. The data are classified and counted according to the grassland group code, such as: I represents Alpine dry grassland, II represents mountain dry grassland, III represents Alpine desert, B represents medium grass group, J represents shrub group, etc, For specific grassland group type codes and their corresponding meanings, see "description of grassland group type codes in Qinghai Province. PDF" in the data set. The data are compiled from the grassland station of Qinghai Province and the grassland resources statistics of Qinghai Province issued in 1988 and 2012. The data set contains three data tables, namely: description of grassland group code in Qinghai Province, grassland type area and livestock carrying capacity statistics of Zeku County (1988), and grassland type area and livestock carrying capacity statistics of Zeku County (2012). The data table structure is similar. For example, there are 8 fields in the statistical data (2012) of grassland type, area and livestock carrying capacity in Zeku County: Field 1: type code Field 2: grassland type name Field 3: grassland area Field 4: available area of grassland Field 5: average unit yield of fresh grass Field 6: average unit yield of edible fresh grass Field 7: stocking capacity Field 8: grassland type grade
AGRICULTURAL AND RURAL Department of Qinghai Province
")
The data set records the statistical data of natural grassland grade area in Zaduo County, Qinghai Province in 1988 and 2012. The data are classified and counted according to the grade code of natural grassland. The grassland is divided into five grades: excellent, good, medium, low and inferior based on the grassland type. The classification criteria of each grade are as follows: Grade I (excellent) Grassland: the weight of excellent forage accounts for more than 60%; Grade II (good grade) Grassland: the weight of grass above good grade accounts for more than 60%, and that of other types accounts for 40%; Grade III (medium) Grassland: the weight of forages above the medium category accounts for more than 60%, and that of other categories accounts for 40%; Grade IV (low) Grassland: the weight of grass above the low category accounts for more than 60%, and that of other categories accounts for 40%; Grade V (inferior) Grassland: the weight of inferior forage accounts for more than 40% The grassland level is divided into 8 levels according to the fresh grass yield. Standards at all levels are as follows: Level 1 Grassland: more than 12000k g of fresh grass per hectare of grassland; Level 2 Grassland: 9000kg ~ 12000kg fresh grass per hectare; Level 3 Grassland: 6000kg ~ 9000kg fresh grass per hectare; Level 4 Grassland: 4500kg ~ 6000kg fresh grass per hectare; Level 5 Grassland: 30001kg ~ 4500kg fresh grass per hectare; Grade 6 Grassland: 1500kg ~ 3000kg fresh grass per hectare; Grade 7 Grassland: 750KG ~ 1500kg fresh grass per hectare; Grade 8 Grassland: fresh grass per hectare is less than 750KG. The data are compiled from the grassland station of Qinghai Province and the grassland resources statistics of Qinghai Province issued in 1988 and 2012. The data set contains two data tables, namely: Statistics of natural grassland grade area in Zaduo county (2012) and statistics of natural grassland grade in Zaduo county (1988). The data table structure is similar. For example, the statistical data of natural grassland grade area in Zaduo county (2012) has 9 fields: Field 1: Total Field 2: Level 1 Field 3: Level 2 Field 4: Level 3 Field 5: Level 4 Field 6: Level 5 Field 7:6 level Field 8: Level 7 Field 9: level 8
AGRICULTURAL AND RURAL Department of Qinghai Province
")
The data set records the statistical data of grassland type area and livestock carrying capacity in Zaduo County, Qinghai Province in 1988 and 2012. The data are classified and counted according to the grassland group code, such as: I represents Alpine dry grassland, II represents mountain dry grassland, III represents Alpine desert, B represents medium grass group, J represents shrub group, etc, For specific grassland group type codes and their corresponding meanings, see "description of grassland group type codes in Qinghai Province. PDF" in the data set. The data are compiled from the grassland station of Qinghai Province and the grassland resources statistics of Qinghai Province issued in 1988 and 2012. The data set contains three data tables, which are: description of grassland group code in Qinghai Province, grassland type area and livestock carrying capacity statistics of Zaduo county (1988), and grassland type area and livestock carrying capacity statistics of Zaduo county (2012). The data table structure is similar. For example, there are 8 fields in the statistical data (2012) of grassland type area and livestock carrying capacity in Zaduo County: Field 1: type code Field 2: grassland type name Field 3: grassland area Field 4: available area of grassland Field 5: average unit yield of fresh grass Field 6: average unit yield of edible fresh grass Field 7: stocking capacity Field 8: grassland type grade
AGRICULTURAL AND RURAL Department of Qinghai Province
")
The data set records the statistical data of natural grassland grade area in Yushu prefecture, Qinghai Province in 1988 and 2012. The data are classified and counted according to the grade code of natural grassland. Grassland is divided into five grades: excellent, good, medium, low and inferior based on grassland type. The classification criteria of each grade are as follows: Grade I (excellent) Grassland: the weight of excellent forage accounts for more than 60%; Grade II (good grade) Grassland: the weight of grass above good grade accounts for more than 60%, and that of other types accounts for 40%; Grade III (medium) Grassland: the weight of forages above the medium category accounts for more than 60%, and that of other categories accounts for 40%; Grade IV (low) Grassland: the weight of grass above the low category accounts for more than 60%, and that of other categories accounts for 40%; Grade V (inferior) Grassland: the weight of inferior forage accounts for more than 40% The grassland level is divided into 8 levels according to the fresh grass yield. Standards at all levels are as follows: Level 1 Grassland: more than 12000k g of fresh grass per hectare of grassland; Level 2 Grassland: 9000kg ~ 12000kg fresh grass per hectare; Level 3 Grassland: 6000kg ~ 9000kg fresh grass per hectare; Level 4 Grassland: 4500kg ~ 6000kg fresh grass per hectare; Level 5 Grassland: 30001kg ~ 4500kg fresh grass per hectare; Grade 6 Grassland: 1500kg ~ 3000kg fresh grass per hectare; Grade 7 Grassland: 750KG ~ 1500kg fresh grass per hectare; Grade 8 Grassland: fresh grass per hectare is less than 750KG. The data are compiled from the grassland station of Qinghai Province and the grassland resources statistics of Qinghai Province issued in 1988 and 2012. The data set contains two data tables, namely: the grade statistics of natural grassland in Yushu Tibetan Autonomous Prefecture (1988) and the grade area statistics of natural grassland in Yushu prefecture (2012). The data table structure is similar. For example, the statistical data of natural grassland grade area in Xunhua County (2012) has 9 fields: Field 1: Total Field 2: Level 1 Field 3: Level 2 Field 4: Level 3 Field 5: Level 4 Field 6: Level 5 Field 7:6 level Field 8: Level 7 Field 9: level 8
AGRICULTURAL AND RURAL Department of Qinghai Province
")
The data set records the statistical data of grassland type area and livestock carrying capacity in Yushu prefecture, Qinghai Province in 1988 and 2012. The data are classified and counted according to the grassland group code, such as: I represents Alpine dry grassland, II represents mountain dry grassland, III represents Alpine desert, B represents medium grass group, J represents shrub group, etc, For specific grassland group type codes and their corresponding meanings, see "description of grassland group type codes in Qinghai Province. PDF" in the data set. The data are compiled from the grassland station of Qinghai Province and the grassland resources statistics of Qinghai Province issued in 1988 and 2012. The data set contains three data tables, namely: description of grassland group code in Qinghai Province, statistical data of grassland area and livestock carrying capacity of various types in Yushu Tibetan Autonomous Prefecture (1988), and statistical data of grassland area and livestock carrying capacity in Yushu county (2012). The data table structure is similar. For example, there are 8 fields in the statistical data (2012) of grassland type, area and livestock carrying capacity in Xunhua County: Field 1: type code Field 2: grassland type name Field 3: grassland area Field 4: available area of grassland Field 5: average unit yield of fresh grass Field 6: average unit yield of edible fresh grass Field 7: stocking capacity Field 8: grassland type grade
AGRICULTURAL AND RURAL Department of Qinghai Province
")
The data set records the statistical data of natural grassland grade area in Xunhua County, Qinghai Province in 1988 and 2012. The data are classified and counted according to the grade code of natural grassland. The grassland is divided into five grades: excellent, good, medium, low and inferior based on the grassland type. The classification criteria of each grade are as follows: Grade I (excellent) Grassland: the weight of excellent forage accounts for more than 60%; Grade II (good grade) Grassland: the weight of grass above good grade accounts for more than 60%, and that of other types accounts for 40%; Grade III (medium) Grassland: the weight of forages above the medium category accounts for more than 60%, and that of other categories accounts for 40%; Grade IV (low) Grassland: the weight of grass above the low category accounts for more than 60%, and that of other categories accounts for 40%; Grade V (inferior) Grassland: the weight of inferior forage accounts for more than 40% The grassland level is divided into 8 levels according to the fresh grass yield. Standards at all levels are as follows: Level 1 Grassland: more than 12000k g of fresh grass per hectare of grassland; Level 2 Grassland: 9000kg ~ 12000kg fresh grass per hectare; Level 3 Grassland: 6000kg ~ 9000kg fresh grass per hectare; Level 4 Grassland: 4500kg ~ 6000kg fresh grass per hectare; Level 5 Grassland: 30001kg ~ 4500kg fresh grass per hectare; Grade 6 Grassland: 1500kg ~ 3000kg fresh grass per hectare; Grade 7 Grassland: 750KG ~ 1500kg fresh grass per hectare; Grade 8 Grassland: fresh grass per hectare is less than 750KG. The data are compiled from the grassland station of Qinghai Province and the grassland resources statistics of Qinghai Province issued in 1988 and 2012. The data set contains two data tables, namely: statistical data of natural grassland grade area in Xunhua County (2012) and statistical data of natural grassland grade in Xunhua County (1988). The data table structure is similar. For example, the statistical data of natural grassland grade area in Xunhua County (2012) has 9 fields: Field 1: Total Field 2: Level 1 Field 3: Level 2 Field 4: Level 3 Field 5: Level 4 Field 6: Level 5 Field 7:6 level Field 8: Level 7 Field 9: level 8
AGRICULTURAL AND RURAL Department of Qinghai Province
")
The data set records the statistical data of grassland type area and livestock carrying capacity in Xunhua County, Qinghai Province in 1988 and 2012. The data are classified and counted according to the grassland group code, such as: I represents Alpine dry grassland, II represents mountain dry grassland, III represents Alpine desert, B represents medium grass group, J represents shrub group, etc, For specific grassland group type codes and their corresponding meanings, see "description of grassland group type codes in Qinghai Province. PDF" in the data set. The data are compiled from the grassland station of Qinghai Province and the grassland resources statistics of Qinghai Province issued in 1988 and 2012. The data set contains three data tables, namely: description of grassland group code in Qinghai Province, grassland type grade area and livestock carrying capacity statistics of Xunhua County (1988), and grassland type area and livestock carrying capacity statistics of Xunhua County (2012). The data table structure is similar. For example, there are 8 fields in the statistical data (2012) of grassland type, area and livestock carrying capacity in Xunhua County: Field 1: type code Field 2: grassland type name Field 3: grassland area Field 4: available area of grassland Field 5: average unit yield of fresh grass Field 6: average unit yield of edible fresh grass Field 7: stocking capacity Field 8: grassland type grade
AGRICULTURAL AND RURAL Department of Qinghai Province
")
The data set records the statistical data of natural grassland grade area in Xinghai County, Qinghai Province in 1988 and 2012. The data are classified and counted according to the grade code of natural grassland. The grassland is divided into five grades: excellent, good, medium, low and inferior based on the grassland type. The classification criteria of each grade are as follows: Grade I (excellent) Grassland: the weight of excellent forage accounts for more than 60%; Grade II (good grade) Grassland: the weight of grass above good grade accounts for more than 60%, and that of other types accounts for 40%; Grade III (medium) Grassland: the weight of forages above the medium category accounts for more than 60%, and that of other categories accounts for 40%; Grade IV (low) Grassland: the weight of grass above the low category accounts for more than 60%, and that of other categories accounts for 40%; Grade V (inferior) Grassland: the weight of inferior forage accounts for more than 40% The grassland level is divided into 8 levels according to the fresh grass yield. Standards at all levels are as follows: Level 1 Grassland: more than 12000k g of fresh grass per hectare of grassland; Level 2 Grassland: 9000kg ~ 12000kg fresh grass per hectare; Level 3 Grassland: 6000kg ~ 9000kg fresh grass per hectare; Level 4 Grassland: 4500kg ~ 6000kg fresh grass per hectare; Level 5 Grassland: 30001kg ~ 4500kg fresh grass per hectare; Grade 6 Grassland: 1500kg ~ 3000kg fresh grass per hectare; Grade 7 Grassland: 750KG ~ 1500kg fresh grass per hectare; Grade 8 Grassland: fresh grass per hectare is less than 750KG. The data are compiled from the grassland station of Qinghai Province and the grassland resources statistics of Qinghai Province issued in 1988 and 2012. The data set contains two data tables, namely: statistical data of natural grassland grade area in Xinghai County (2012) and statistical data of natural grassland grade in Xinghai County (1988). The data table structure is similar. For example, the statistical data of natural grassland grade area in Xinghai County (2012) has 9 fields: Field 1: Total Field 2: Level 1 Field 3: Level 2 Field 4: Level 3 Field 5: Level 4 Field 6: Level 5 Field 7:6 level Field 8: Level 7 Field 9: level 8
AGRICULTURAL AND RURAL Department of Qinghai Province
")
The data set records the statistical data of natural grassland grade area in Xining City, Qinghai Province in 1988 and 2012. The data are classified and counted according to the grade code of natural grassland. The grassland is divided into five grades: excellent, good, medium, low and inferior based on the grassland type. The classification criteria of each grade are as follows: Grade I (excellent) Grassland: the weight of excellent forage accounts for more than 60%; Grade II (good grade) Grassland: the weight of grass above good grade accounts for more than 60%, and that of other types accounts for 40%; Grade III (medium) Grassland: the weight of forages above the medium category accounts for more than 60%, and that of other categories accounts for 40%; Grade IV (low) Grassland: the weight of grass above the low category accounts for more than 60%, and that of other categories accounts for 40%; Grade V (inferior) Grassland: the weight of inferior forage accounts for more than 40% The grassland level is divided into 8 levels according to the fresh grass yield. Standards at all levels are as follows: Level 1 Grassland: more than 12000k g of fresh grass per hectare of grassland; Level 2 Grassland: 9000kg ~ 12000kg fresh grass per hectare; Level 3 Grassland: 6000kg ~ 9000kg fresh grass per hectare; Level 4 Grassland: 4500kg ~ 6000kg fresh grass per hectare; Level 5 Grassland: 30001kg ~ 4500kg fresh grass per hectare; Grade 6 Grassland: 1500kg ~ 3000kg fresh grass per hectare; Grade 7 Grassland: 750KG ~ 1500kg fresh grass per hectare; Grade 8 Grassland: fresh grass per hectare is less than 750KG. The data are compiled from the grassland station of Qinghai Province and the grassland resources statistics of Qinghai Province issued in 1988 and 2012. The data set contains two data tables, namely: Statistics of natural grassland grade area in Xining City (2012), statistics of natural grassland type grade area and livestock carrying capacity in Xining City (1988). The data table structure is similar. For example, the statistical data of natural grassland grade area in Xining City (2012) has 9 fields: Field 1: Total Field 2: Level 1 Field 3: Level 2 Field 4: Level 3 Field 5: Level 4 Field 6: Level 5 Field 7:6 level Field 8: Level 7 Field 9: level 8
AGRICULTURAL AND RURAL Department of Qinghai Province
")
The data set records the statistical data of grassland type area and livestock carrying capacity in Xinghai County, Qinghai Province in 1988 and 2012. The data are classified and counted according to the grassland group code, such as: I represents Alpine dry grassland, II represents mountain dry grassland, III represents Alpine desert, B represents medium grass group, J represents shrub group, etc, For specific grassland group type codes and their corresponding meanings, see "description of grassland group type codes in Qinghai Province. PDF" in the data set. The data are compiled from the grassland station of Qinghai Province and the grassland resources statistics of Qinghai Province issued in 1988 and 2012. The data set contains three data tables, which are: description of grassland group code in Qinghai Province, grassland type area and livestock carrying capacity statistics of Xinghai County (2012), and grassland type area and livestock carrying capacity statistics of Xinghai County (1988). The data table structure is similar. For example, there are 8 fields in the statistical data (2012) of grassland type, area and livestock carrying capacity in Xinghai County: Field 1: type code Field 2: grassland type name Field 3: grassland area Field 4: available area of grassland Field 5: average unit yield of fresh grass Field 6: average unit yield of edible fresh grass Field 7: stocking capacity Field 8: grassland type grade
AGRICULTURAL AND RURAL Department of Qinghai Province
")
The data set records the statistical data of natural grassland grade area in Xining City, Qinghai Province in 1988 and 2012. The data are classified and counted according to the grade code of natural grassland. The grassland is divided into five grades: excellent, good, medium, low and poor based on the grassland type. The classification criteria of each grade are as follows: Grade I (excellent) Grassland: the weight of excellent forage accounts for more than 60%; Grade II (good grade) Grassland: the weight of grass above good grade accounts for more than 60%, and that of other types accounts for 40%; Grade III (medium) Grassland: the weight of forages above the medium category accounts for more than 60%, and that of other categories accounts for 40%; Grade IV (low) Grassland: the weight of grass above the low category accounts for more than 60%, and that of other categories accounts for 40%; Grade V (inferior) Grassland: the weight of inferior forage accounts for more than 40% The grassland level is divided into 8 levels according to the fresh grass yield. Standards at all levels are as follows: Level 1 Grassland: more than 12000k g of fresh grass per hectare of grassland; Level 2 Grassland: 9000kg ~ 12000kg fresh grass per hectare; Level 3 Grassland: 6000kg ~ 9000kg fresh grass per hectare; Level 4 Grassland: 4500kg ~ 6000kg fresh grass per hectare; Level 5 Grassland: 30001kg ~ 4500kg fresh grass per hectare; Grade 6 Grassland: 1500kg ~ 3000kg fresh grass per hectare; Grade 7 Grassland: 750KG ~ 1500kg fresh grass per hectare; Grade 8 Grassland: fresh grass per hectare is less than 750KG. The data are compiled from the grassland station of Qinghai Province and the grassland resources statistics of Qinghai Province issued in 1988 and 2012. The data set contains two data tables, namely: Statistics of natural grassland grade area in Xining City (2012) and statistics of natural grassland grade in Xining City (1988). The data table structure is similar. For example, the statistical data of natural grassland grade area in Xining (2012) has 9 fields: Field 1: Total Field 2: Level 1 Field 3: Level 2 Field 4: Level 3 Field 5: Level 4 Field 6: Level 5 Field 7:6 level Field 8: Level 7 Field 9: level 8
AGRICULTURAL AND RURAL Department of Qinghai Province
")
The data set records the statistical data of grassland type area and livestock carrying capacity in Xining City, Qinghai Province in 1988 and 2012. The data are classified and counted according to the grassland group code, such as: I represents Alpine dry grassland, II represents mountain dry grassland, III represents Alpine desert, B represents medium grass group, J represents shrub group, etc, For specific grassland group type codes and their corresponding meanings, see "description of grassland group type codes in Qinghai Province. PDF" in the data set. The data are compiled from the grassland station of Qinghai Province and the grassland resources statistics of Qinghai Province issued in 1988 and 2012. The data set contains three data tables, namely: description of grassland group code in Qinghai Province, statistics of grassland type area and livestock carrying capacity in Xining City (1988), and statistics of grassland type area and livestock carrying capacity in Xining City (2012). The data table structure is similar. For example, there are 8 fields in the statistical data (2012) of grassland type, area and livestock carrying capacity in Xining urban area: Field 1: type code Field 2: grassland type name Field 3: grassland area Field 4: available area of grassland Field 5: average unit yield of fresh grass Field 6: average unit yield of edible fresh grass Field 7: stocking capacity Field 8: grassland type grade
AGRICULTURAL AND RURAL Department of Qinghai Province
")
The data set records the statistical data of grassland type area and livestock carrying capacity in Xining City, Qinghai Province in 1988 and 2012. The data are classified and counted according to the grassland group code, such as: I represents Alpine dry grassland, II represents mountain dry grassland, III represents Alpine desert, B represents medium grass group, J represents shrub group, etc, For specific grassland group type codes and their corresponding meanings, see "description of grassland group type codes in Qinghai Province. PDF" in the data set. The data are compiled from the grassland station of Qinghai Province and the grassland resources statistics of Qinghai Province issued in 1988 and 2012. The data set contains three data tables, namely: description of grassland group code in Qinghai Province, statistical data of grassland area and livestock carrying capacity of various types in Xining City (1988), and statistical data of grassland area and livestock carrying capacity of Xining City (2012). The data table structure is similar. For example, there are 8 fields in the statistical data (2012) of grassland type, area and livestock carrying capacity in Xining City: Field 1: type code Field 2: grassland type name Field 3: grassland area Field 4: available area of grassland Field 5: average unit yield of fresh grass Field 6: average unit yield of edible fresh grass Field 7: stocking capacity Field 8: grassland type, etc
AGRICULTURAL AND RURAL Department of Qinghai Province
")
The data set records the statistical data of natural grassland grade area in Wulan County, Qinghai Province in 1988 and 2012. The data are classified and counted according to the grade code of natural grassland. The grassland is divided into five grades: excellent, good, medium, low and inferior based on the grassland type. The classification criteria of each grade are as follows: Grade I (excellent) Grassland: the weight of excellent forage accounts for more than 60%; Grade II (good grade) Grassland: the weight of grass above good grade accounts for more than 60%, and that of other types accounts for 40%; Grade III (medium) Grassland: the weight of forages above the medium category accounts for more than 60%, and that of other categories accounts for 40%; Grade IV (low) Grassland: the weight of grass above the low category accounts for more than 60%, and that of other categories accounts for 40%; Grade V (inferior) Grassland: the weight of inferior forage accounts for more than 40% The grassland level is divided into 8 levels according to the fresh grass yield. Standards at all levels are as follows: Level 1 Grassland: more than 12000k g of fresh grass per hectare of grassland; Level 2 Grassland: 9000kg ~ 12000kg fresh grass per hectare; Level 3 Grassland: 6000kg ~ 9000kg fresh grass per hectare; Level 4 Grassland: 4500kg ~ 6000kg fresh grass per hectare; Level 5 Grassland: 30001kg ~ 4500kg fresh grass per hectare; Grade 6 Grassland: 1500kg ~ 3000kg fresh grass per hectare; Grade 7 Grassland: 750KG ~ 1500kg fresh grass per hectare; Grade 8 Grassland: fresh grass per hectare is less than 750KG. The data are compiled from the grassland station of Qinghai Province and the grassland resources statistics of Qinghai Province issued in 1988 and 2012. The data set contains two data tables, namely: statistical data of natural grassland grade area in Wulan county (2012) and statistical data of natural grassland grade in Wulan county (1988). The data table structure is similar. For example, there are 9 fields in the statistical data of natural grassland grade area in Wulan county (2012): Field 1: Total Field 2: Level 1 Field 3: Level 2 Field 4: Level 3 Field 5: Level 4 Field 6: Level 5 Field 7:6 level Field 8: Level 7 Field 9: level 8
AGRICULTURAL AND RURAL Department of Qinghai Province
")
The data set records the statistical data of grassland type area and livestock carrying capacity in Wulan County, Qinghai Province in 1988 and 2012. The data are classified and counted according to the grassland group code, such as: I represents Alpine dry grassland, II represents mountain dry grassland, III represents Alpine desert, B represents medium grass group, J represents shrub group, etc, For specific grassland group type codes and their corresponding meanings, see "description of grassland group type codes in Qinghai Province. PDF" in the data set. The data are compiled from the grassland station of Qinghai Province and the grassland resources statistics of Qinghai Province issued in 1988 and 2012. The data set contains three data tables, which are: description of grassland group code in Qinghai Province, statistical data of grassland type area and livestock carrying capacity in Wulan county (1988), and statistical data of grassland type area and livestock carrying capacity in Wulan county (2012). The data table structure is similar. For example, the statistical data of grassland type, area and livestock carrying capacity in Wulan County - (2012) has 8 fields: Field 1: type code Field 2: grassland type name Field 3: grassland area Field 4: available area of grassland Field 5: average unit yield of fresh grass Field 6: average unit yield of edible fresh grass Field 7: stocking capacity Field 8: grassland type grade
AGRICULTURAL AND RURAL Department of Qinghai Province
")
The data set records the statistical data of natural grassland grade area in Tongren County, Qinghai Province in 1988 and 2012. The data are classified and counted according to the grade code of natural grassland. The grassland is divided into five grades: excellent, good, medium, low and poor with grassland type as the basic unit. The classification criteria of each grade are as follows: Grade I (excellent) Grassland: the weight of excellent forage accounts for more than 60%; Grade II (good grade) Grassland: the weight of grass above good grade accounts for more than 60%, and that of other types accounts for 40%; Grade III (medium) Grassland: the weight of forages above the medium category accounts for more than 60%, and that of other categories accounts for 40%; Grade IV (low) Grassland: the weight of grass above the low category accounts for more than 60%, and that of other categories accounts for 40%; Grade V (inferior) Grassland: the weight of inferior forage accounts for more than 40% The grassland level is divided into 8 levels according to the fresh grass yield. Standards at all levels are as follows: Level 1 Grassland: more than 12000k g of fresh grass per hectare of grassland; Level 2 Grassland: 9000kg ~ 12000kg fresh grass per hectare; Level 3 Grassland: 6000kg ~ 9000kg fresh grass per hectare; Level 4 Grassland: 4500kg ~ 6000kg fresh grass per hectare; Level 5 Grassland: 30001kg ~ 4500kg fresh grass per hectare; Grade 6 Grassland: 1500kg ~ 3000kg fresh grass per hectare; Grade 7 Grassland: 750KG ~ 1500kg fresh grass per hectare; Grade 8 Grassland: fresh grass per hectare is less than 750KG. The data are compiled from the grassland station of Qinghai Province and the grassland resources statistics of Qinghai Province issued in 1988 and 2012. The data set contains two data tables, namely: Statistics of natural grassland grade area in Tongren County (2012) and statistics of natural grassland grade in Tongren County (1988). The data table structure is similar. For example, there are 9 fields in the statistical data of natural grassland grade area in Tongren County (2012): Field 1: Total Field 2: Level 1 Field 3: Level 2 Field 4: Level 3 Field 5: Level 4 Field 6: Level 5 Field 7:6 level Field 8: Level 7 Field 9: level 8
AGRICULTURAL AND RURAL Department of Qinghai Province
")
The data set records the statistical data of grassland type area and livestock carrying capacity in Tongren County, Qinghai Province in 1988 and 2012. The data are classified and counted according to the grassland group code, such as: I represents Alpine dry grassland, II represents mountain dry grassland, III represents Alpine desert, B represents medium grass group, J represents shrub group, etc, For specific grassland group type codes and their corresponding meanings, see "description of grassland group type codes in Qinghai Province. PDF" in the data set. The data are compiled from the grassland station of Qinghai Province and the grassland resources statistics of Qinghai Province issued in 1988 and 2012. The data set contains three data tables, namely: description of grassland group code in Qinghai Province, statistics of grassland type area and livestock carrying capacity in Tongren County (1988), and statistics of grassland type area and livestock carrying capacity in Tongren County (2012). The data table structure is similar. For example, there are 8 fields in the statistical data (2012) of grassland type, area and livestock carrying capacity in Tongren County: Field 1: type code Field 2: grassland type name Field 3: grassland area Field 4: available area of grassland Field 5: average unit yield of fresh grass Field 6: average unit yield of edible fresh grass Field 7: stocking capacity Field 8: grassland type grade
AGRICULTURAL AND RURAL Department of Qinghai Province
")
The data set records the statistical data of natural grassland grade area in Tongde County, Qinghai Province in 1988 and 2012. The data are classified and counted according to the grade code of natural grassland. The grassland is divided into five grades: excellent, good, medium, low and inferior based on the grassland type. The classification criteria of each grade are as follows: Grade I (excellent) Grassland: the weight of excellent forage accounts for more than 60%; Grade II (good grade) Grassland: the weight of grass above good grade accounts for more than 60%, and that of other types accounts for 40%; Grade III (medium) Grassland: the weight of forages above the medium category accounts for more than 60%, and that of other categories accounts for 40%; Grade IV (low) Grassland: the weight of grass above the low category accounts for more than 60%, and that of other categories accounts for 40%; Grade V (inferior) Grassland: the weight of inferior forage accounts for more than 40% The grassland level is divided into 8 levels according to the fresh grass yield. Standards at all levels are as follows: Level 1 Grassland: more than 12000k g of fresh grass per hectare of grassland; Level 2 Grassland: 9000kg ~ 12000kg fresh grass per hectare; Level 3 Grassland: 6000kg ~ 9000kg fresh grass per hectare; Level 4 Grassland: 4500kg ~ 6000kg fresh grass per hectare; Level 5 Grassland: 30001kg ~ 4500kg fresh grass per hectare; Grade 6 Grassland: 1500kg ~ 3000kg fresh grass per hectare; Grade 7 Grassland: 750KG ~ 1500kg fresh grass per hectare; Grade 8 Grassland: fresh grass per hectare is less than 750KG. The data are compiled from the grassland station of Qinghai Province and the grassland resources statistics of Qinghai Province issued in 1988 and 2012. The data set contains two data tables: statistical data of natural grassland grade area in Tongde County (2012) and statistical data of natural grassland grade in Tongde County (1988). The data table structure is similar. For example, the statistical data of natural grassland grade area in Tongde County (2012) has 9 fields: Field 1: Total Field 2: Level 1 Field 3: Level 2 Field 4: Level 3 Field 5: Level 4 Field 6: Level 5 Field 7:6 level Field 8: Level 7 Field 9: level 8
AGRICULTURAL AND RURAL Department of Qinghai Province
")
The data set records the statistical data of grassland type area and livestock carrying capacity in Tongde County, Qinghai Province in 1988 and 2012. The data are classified and counted according to the grassland group code, such as: I represents Alpine dry grassland, II represents mountain dry grassland, III represents Alpine desert, B represents medium grass group, J represents shrub group, etc, For specific grassland group type codes and their corresponding meanings, see "description of grassland group type codes in Qinghai Province. PDF" in the data set. The data are compiled from the grassland station of Qinghai Province and the grassland resources statistics of Qinghai Province issued in 1988 and 2012. The data set contains three data tables, namely: description of grassland group code in Qinghai Province, statistical data of grassland type area and livestock carrying capacity in Tongde County (2012), and statistical data of grassland type area and livestock carrying capacity in Tongde County (1988). The data table structure is similar. For example, there are 8 fields in the statistical data (2012) of grassland type, area and livestock carrying capacity in Tongde County: Field 1: type code Field 2: grassland type name Field 3: grassland area Field 4: available area of grassland Field 5: average unit yield of fresh grass Field 6: average unit yield of edible fresh grass Field 7: stocking capacity Field 8: grassland type grade
AGRICULTURAL AND RURAL Department of Qinghai Province
")
The data set records the statistical data of natural grassland grade area in Qinghai Province in 1988 and 2012. The data are classified and counted according to the grade code of natural grassland. The grassland is divided into five grades: excellent, good, medium, low and poor with grassland type as the basic unit. The classification criteria of each grade are as follows: Grade I (excellent) Grassland: the weight of excellent forage accounts for more than 60%; Grade II (good grade) Grassland: the weight of grass above good grade accounts for more than 60%, and that of other types accounts for 40%; Grade III (medium) Grassland: the weight of forages above the medium category accounts for more than 60%, and that of other categories accounts for 40%; Grade IV (low) Grassland: the weight of grass above the low category accounts for more than 60%, and that of other categories accounts for 40%; Grade V (inferior) Grassland: the weight of inferior forage accounts for more than 40% The grassland level is divided into 8 levels according to the fresh grass yield. Standards at all levels are as follows: Level 1 Grassland: more than 12000k g of fresh grass per hectare of grassland; Level 2 Grassland: 9000kg ~ 12000kg fresh grass per hectare; Level 3 Grassland: 6000kg ~ 9000kg fresh grass per hectare; Level 4 Grassland: 4500kg ~ 6000kg fresh grass per hectare; Level 5 Grassland: 30001kg ~ 4500kg fresh grass per hectare; Grade 6 Grassland: 1500kg ~ 3000kg fresh grass per hectare; Grade 7 Grassland: 750KG ~ 1500kg fresh grass per hectare; Grade 8 Grassland: fresh grass per hectare is less than 750KG. The data are compiled from the grassland station of Qinghai Province and the grassland resources statistics of Qinghai Province issued in 1988 and 2012. The data set contains two data tables, namely: the statistical data of natural grassland grade area in Qinghai Province (2012) and the statistical data of natural grassland grade in Qinghai Province (1988). The data table structure is similar. For example, there are 9 fields in the statistical data of natural grassland grade area in Qinghai Province (2012): Field 1: Total Field 2: Level 1 Field 3: Level 2 Field 4: Level 3 Field 5: Level 4 Field 6: Level 5 Field 7:6 level Field 8: Level 7 Field 9: level 8
AGRICULTURAL AND RURAL Department of Qinghai Province
")
The data set records the statistical data of natural grassland grade area in Tianjun County, Qinghai Province in 1988 and 2012. The data are classified and counted according to the grade code of natural grassland. The grassland is divided into five grades: excellent, good, medium, low and inferior with grassland type as the basic unit. The classification criteria of each grade are as follows: Grade I (excellent) Grassland: the weight of excellent forage accounts for more than 60%; Grade II (good grade) Grassland: the weight of grass above good grade accounts for more than 60%, and that of other types accounts for 40%; Grade III (medium) Grassland: the weight of forages above the medium category accounts for more than 60%, and that of other categories accounts for 40%; Grade IV (low) Grassland: the weight of grass above the low category accounts for more than 60%, and that of other categories accounts for 40%; Grade V (inferior) Grassland: the weight of inferior forage accounts for more than 40% The grassland level is divided into 8 levels according to the fresh grass yield. Standards at all levels are as follows: Level 1 Grassland: more than 12000k g of fresh grass per hectare of grassland; Level 2 Grassland: 9000kg ~ 12000kg fresh grass per hectare; Level 3 Grassland: 6000kg ~ 9000kg fresh grass per hectare; Level 4 Grassland: 4500kg ~ 6000kg fresh grass per hectare; Level 5 Grassland: 30001kg ~ 4500kg fresh grass per hectare; Grade 6 Grassland: 1500kg ~ 3000kg fresh grass per hectare; Grade 7 Grassland: 750KG ~ 1500kg fresh grass per hectare; Grade 8 Grassland: fresh grass per hectare is less than 750KG. The data are compiled from the grassland station of Qinghai Province and the grassland resources statistics of Qinghai Province issued in 1988 and 2012. The data set contains two data tables, namely: statistical data of natural grassland grade area in Tianjun county (2012) and statistical data of natural grassland grade in Tianjun county (1988). The data table structure is similar. For example, the statistical data of natural grassland grade area in Tianjun county (2012) has 9 fields: Field 1: Total Field 2: Level 1 Field 3: Level 2 Field 4: Level 3 Field 5: Level 4 Field 6: Level 5 Field 7:6 level Field 8: Level 7 Field 9: level 8
AGRICULTURAL AND RURAL Department of Qinghai Province
")
The data set records the statistical data of grassland type area and livestock carrying capacity in Tianjun County, Qinghai Province in 1988 and 2012. The data are classified and counted according to the grassland group code, such as: I represents Alpine dry grassland, II represents mountain dry grassland, III represents Alpine desert, B represents medium grass group, J represents shrub group, etc, For specific grassland group type codes and their corresponding meanings, see "description of grassland group type codes in Qinghai Province. PDF" in the data set. The data are compiled from the grassland station of Qinghai Province and the grassland resources statistics of Qinghai Province issued in 1988 and 2012. The data set contains three data tables, namely: description of grassland group code in Qinghai Province, grassland type area and livestock carrying capacity statistics of Tianjun county (1988), and grassland type area and livestock carrying capacity statistics of Tianjun county (2012). The data table structure is similar. For example, there are 8 fields in the statistical data (2012) of grassland type, area and livestock carrying capacity in Tianjun County: Field 1: type code Field 2: grassland type name Field 3: grassland area Field 4: available area of grassland Field 5: average unit yield of fresh grass Field 6: average unit yield of edible fresh grass Field 7: stocking capacity Field 8: grassland type grade
AGRICULTURAL AND RURAL Department of Qinghai Province
")
The data set records the statistical data of forage resources and livestock carrying capacity in Qinghai Province in 1988 and 2012. The data are classified and counted according to the grade code of natural grassland. The grassland is divided into five grades: excellent, good, medium, low and poor with grassland type as the basic unit. The classification criteria of each grade are as follows: Grade I (excellent) Grassland: the weight of excellent forage accounts for more than 60%; Grade II (good grade) Grassland: the weight of grass above good grade accounts for more than 60%, and that of other types accounts for 40%; Grade III (medium) Grassland: the weight of forages above the medium category accounts for more than 60%, and that of other categories accounts for 40%; Grade IV (low) Grassland: the weight of grass above the low category accounts for more than 60%, and that of other categories accounts for 40%; Grade V (inferior) Grassland: the weight of inferior forage accounts for more than 40% The grassland level is divided into 8 levels according to the fresh grass yield. Standards at all levels are as follows: Level 1 Grassland: more than 12000k g of fresh grass per hectare of grassland; Level 2 Grassland: 9000kg ~ 12000kg fresh grass per hectare; Level 3 Grassland: 6000kg ~ 9000kg fresh grass per hectare; Level 4 Grassland: 4500kg ~ 6000kg fresh grass per hectare; Level 5 Grassland: 30001kg ~ 4500kg fresh grass per hectare; Grade 6 Grassland: 1500kg ~ 3000kg fresh grass per hectare; Grade 7 Grassland: 750KG ~ 1500kg fresh grass per hectare; Grade 8 Grassland: fresh grass per hectare is less than 750KG. The data are compiled from the grassland station of Qinghai Province and the grassland resources statistics of Qinghai Province issued in 1988 and 2012. The data set contains two data tables, namely, the statistical data of forage resources and livestock carrying capacity in Qinghai Province (1988) and the statistical data of forage resources and livestock carrying capacity in Qinghai Province (2012). The data table structure is similar. For example, there are 13 fields in the statistical data of forage resources and livestock carrying capacity in Qinghai Province (2012): Field 1: administrative unit Field 2: number of livestock and sheep in 2009 Field 3: total theoretical stocking capacity Field 4: Natural Grassland Field 5: total forage Field 6: stocking capacity Field 7: Artificial Grassland Field 8: Crop Straw Field 9: stocking potential
AGRICULTURAL AND RURAL Department of Qinghai Province
")
The data set records the statistical data of natural grassland grade area in qumalai County, Qinghai Province in 1988 and 2012. The data are classified and counted according to the grade code of natural grassland. The grassland is divided into five grades: excellent, good, medium, low and inferior based on the grassland type. The classification criteria of each grade are as follows: Grade I (excellent) Grassland: the weight of excellent forage accounts for more than 60%; Grade II (good grade) Grassland: the weight of grass above good grade accounts for more than 60%, and that of other types accounts for 40%; Grade III (medium) Grassland: the weight of forages above the medium category accounts for more than 60%, and that of other categories accounts for 40%; Grade IV (low) Grassland: the weight of grass above the low category accounts for more than 60%, and that of other categories accounts for 40%; Grade V (inferior) Grassland: the weight of inferior forage accounts for more than 40% The grassland level is divided into 8 levels according to the fresh grass yield. Standards at all levels are as follows: Level 1 Grassland: more than 12000k g of fresh grass per hectare of grassland; Level 2 Grassland: 9000kg ~ 12000kg fresh grass per hectare; Level 3 Grassland: 6000kg ~ 9000kg fresh grass per hectare; Level 4 Grassland: 4500kg ~ 6000kg fresh grass per hectare; Level 5 Grassland: 30001kg ~ 4500kg fresh grass per hectare; Grade 6 Grassland: 1500kg ~ 3000kg fresh grass per hectare; Grade 7 Grassland: 750KG ~ 1500kg fresh grass per hectare; Grade 8 Grassland: fresh grass per hectare is less than 750KG. The data are compiled from the grassland station of Qinghai Province and the grassland resources statistics of Qinghai Province issued in 1988 and 2012. The data set contains two data tables, namely: statistical data of natural grassland grade area in qumalai county (2012) and statistical data of natural grassland grade in qumalai county (1988). The data table structure is similar. For example, there are 9 fields in the statistical data of natural grassland grade area in Qilian county (2012): Field 1: Total Field 2: Level 1 Field 3: Level 2 Field 4: Level 3 Field 5: Level 4 Field 6: Level 5 Field 7:6 level Field 8: Level 7 Field 9: level 8
AGRICULTURAL AND RURAL Department of Qinghai Province
")
The data set records the statistical data of grassland type area and livestock carrying capacity in qumalai County, Qinghai Province in 1988 and 2012. The data are classified and counted according to the grassland group code, such as: I represents Alpine dry grassland, II represents mountain dry grassland, III represents Alpine desert, B represents medium grass group, J represents shrub group, etc, For specific grassland group type codes and their corresponding meanings, see "description of grassland group type codes in Qinghai Province. PDF" in the data set. The data are compiled from the grassland station of Qinghai Province and the grassland resources statistics of Qinghai Province issued in 1988 and 2012. The data set contains three data tables, namely: description of grassland group code in Qinghai Province, grassland type area and livestock carrying capacity statistics of qumalai county (2012), and grassland type area and livestock carrying capacity statistics of qumalai county (1988). The data table structure is similar. For example, there are 8 fields in the statistical data (2012) of grassland type, area and livestock carrying capacity in qumalai County: Field 1: type code Field 2: grassland type name Field 3: grassland area Field 4: available area of grassland Field 5: average unit yield of fresh grass Field 6: average unit yield of edible fresh grass Field 7: stocking capacity Field 8: grassland type grade
AGRICULTURAL AND RURAL Department of Qinghai Province
")
The data set records the statistical data of grassland type area and livestock carrying capacity in Qilian County, Qinghai Province in 1988 and 2012. The data are classified and counted according to the grassland group code, such as: I represents Alpine dry grassland, II represents mountain dry grassland, III represents Alpine desert, B represents medium grass group, J represents shrub group, etc, For specific grassland group type codes and their corresponding meanings, see "description of grassland group type codes in Qinghai Province. PDF" in the data set. The data are compiled from the grassland station of Qinghai Province and the grassland resources statistics of Qinghai Province issued in 1988 and 2012. The data set contains three data tables, which are: code description of grassland group type in Qinghai Province, statistical data of grassland type area and livestock carrying capacity in Qilian county (1988), and statistical data of grassland type area and livestock carrying capacity in Qilian county (2012). The data table structure is similar. For example, there are 8 fields in the statistical data (2012) of grassland type area and livestock carrying capacity in Qilian County: Field 1: type code Field 2: grassland type name Field 3: grassland area Field 4: available area of grassland Field 5: average unit yield of fresh grass Field 6: average unit yield of edible fresh grass Field 7: stocking capacity Field 8: grassland type grade
AGRICULTURAL AND RURAL Department of Qinghai Province
")
The data set records the statistical data of natural grassland grade area in Qilian County, Qinghai Province in 1988 and 2012. The data are classified and counted according to the grade code of natural grassland. The grassland is divided into five grades: excellent, good, medium, low and inferior based on the grassland type. The classification criteria of each grade are as follows: Grade I (excellent) Grassland: the weight of excellent forage accounts for more than 60%; Grade II (good grade) Grassland: the weight of grass above good grade accounts for more than 60%, and that of other types accounts for 40%; Grade III (medium) Grassland: the weight of forages above the medium category accounts for more than 60%, and that of other categories accounts for 40%; Grade IV (low) Grassland: the weight of grass above the low category accounts for more than 60%, and that of other categories accounts for 40%; Grade V (inferior) Grassland: the weight of inferior forage accounts for more than 40% The grassland level is divided into 8 levels according to the fresh grass yield. Standards at all levels are as follows: Level 1 Grassland: more than 12000k g of fresh grass per hectare of grassland; Level 2 Grassland: 9000kg ~ 12000kg fresh grass per hectare; Level 3 Grassland: 6000kg ~ 9000kg fresh grass per hectare; Level 4 Grassland: 4500kg ~ 6000kg fresh grass per hectare; Level 5 Grassland: 30001kg ~ 4500kg fresh grass per hectare; Grade 6 Grassland: 1500kg ~ 3000kg fresh grass per hectare; Grade 7 Grassland: 750KG ~ 1500kg fresh grass per hectare; Grade 8 Grassland: fresh grass per hectare is less than 750KG. The data are compiled from the grassland station of Qinghai Province and the grassland resources statistics of Qinghai Province issued in 1988 and 2012. The data set contains two data tables, namely: Qilian county natural grassland grade area statistics (2012) and Qilian county natural grassland grade Statistics (1988). The data table structure is similar. For example, there are 9 fields in the statistical data of natural grassland grade area in Qilian county (2012): Field 1: Total Field 2: Level 1 Field 3: Level 2 Field 4: Level 3 Field 5: Level 4 Field 6: Level 5 Field 7:6 level Field 8: Level 7 Field 9: level 8
AGRICULTURAL AND RURAL Department of Qinghai Province
")
The data set records the statistical data of natural grassland grade area in Ping'an County, Qinghai Province in 1988 and 2012. The data are classified and counted according to the grade code of natural grassland. The grassland is divided into five grades: excellent, good, medium, low and poor with grassland type as the basic unit. The classification criteria of each grade are as follows: Grade I (excellent) Grassland: the weight of excellent forage accounts for more than 60%; Grade II (good grade) Grassland: the weight of grass above good grade accounts for more than 60%, and that of other types accounts for 40%; Grade III (medium) Grassland: the weight of forages above the medium category accounts for more than 60%, and that of other categories accounts for 40%; Grade IV (low) Grassland: the weight of grass above the low category accounts for more than 60%, and that of other categories accounts for 40%; Grade V (inferior) Grassland: the weight of inferior forage accounts for more than 40% The grassland level is divided into 8 levels according to the fresh grass yield. Standards at all levels are as follows: Level 1 Grassland: more than 12000k g of fresh grass per hectare of grassland; Level 2 Grassland: 9000kg ~ 12000kg fresh grass per hectare; Level 3 Grassland: 6000kg ~ 9000kg fresh grass per hectare; Level 4 Grassland: 4500kg ~ 6000kg fresh grass per hectare; Level 5 Grassland: 30001kg ~ 4500kg fresh grass per hectare; Grade 6 Grassland: 1500kg ~ 3000kg fresh grass per hectare; Grade 7 Grassland: 750KG ~ 1500kg fresh grass per hectare; Grade 8 Grassland: fresh grass per hectare is less than 750KG. The data are compiled from the grassland station of Qinghai Province and the grassland resources statistics of Qinghai Province issued in 1988 and 2012. The data set contains two data tables, namely: statistical data of natural grassland grade area in Ping'an County (2012) and statistical data of natural grassland grade in Ping'an County (1988). The data table structure is similar. For example, there are 9 fields in the statistical data of natural grassland grade area in Ping'an County (2012): Field 1: Total Field 2: Level 1 Field 3: Level 2 Field 4: Level 3 Field 5: Level 4 Field 6: Level 5 Field 7:6 level Field 8: Level 7 Field 9: level 8
AGRICULTURAL AND RURAL Department of Qinghai Province
")
The data set records the statistical data of grassland type area and livestock carrying capacity in Ping'an County, Qinghai Province in 1988 and 2012. The data are classified and counted according to the grassland group code, such as: I represents Alpine dry grassland, II represents mountain dry grassland, III represents Alpine desert, B represents medium grass group, J represents shrub group, etc, For specific grassland group type codes and their corresponding meanings, see "description of grassland group type codes in Qinghai Province. PDF" in the data set. The data are compiled from the grassland station of Qinghai Province and the grassland resources statistics of Qinghai Province issued in 1988 and 2012. The data set contains three data tables, which are: grassland type area and livestock carrying capacity statistics of Ping'an County (1988), grassland type area and livestock carrying capacity statistics of Ping'an County (2012) and grassland group code description of Qinghai Province. The data table structure is similar. For example, there are 8 fields in the statistical data (2012) of grassland type area and livestock carrying capacity in Ping'an County: Field 1: type code Field 2: grassland type name Field 3: grassland area Field 4: available area of grassland Field 5: average unit yield of fresh grass Field 6: average unit yield of edible fresh grass Field 7: stocking capacity Field 8: grassland type grade
AGRICULTURAL AND RURAL Department of Qinghai Province
")
The data set records the statistical data of natural grassland grade area in Baoqian County, Qinghai Province in 1988 and 2012. The data are classified and counted according to the grade code of natural grassland. The grassland is divided into five grades: excellent, good, medium, low and inferior with grassland type as the basic unit. The classification criteria of each grade are as follows: Grade I (excellent) Grassland: the weight of excellent forage accounts for more than 60%; Grade II (good grade) Grassland: the weight of grass above good grade accounts for more than 60%, and that of other types accounts for 40%; Grade III (medium) Grassland: the weight of forages above the medium category accounts for more than 60%, and that of other categories accounts for 40%; Grade IV (low) Grassland: the weight of grass above the low category accounts for more than 60%, and that of other categories accounts for 40%; Grade V (inferior) Grassland: the weight of inferior forage accounts for more than 40% The grassland level is divided into 8 levels according to the fresh grass yield. Standards at all levels are as follows: Level 1 Grassland: more than 12000k g of fresh grass per hectare of grassland; Level 2 Grassland: 9000kg ~ 12000kg fresh grass per hectare; Level 3 Grassland: 6000kg ~ 9000kg fresh grass per hectare; Level 4 Grassland: 4500kg ~ 6000kg fresh grass per hectare; Level 5 Grassland: 30001kg ~ 4500kg fresh grass per hectare; Grade 6 Grassland: 1500kg ~ 3000kg fresh grass per hectare; Grade 7 Grassland: 750KG ~ 1500kg fresh grass per hectare; Grade 8 Grassland: fresh grass per hectare is less than 750KG. The data are compiled from the grassland station of Qinghai Province and the grassland resources statistics of Qinghai Province issued in 1988 and 2012. The data set contains two data tables, namely: statistical data of natural grassland grade area in Nangqian county (2012) and statistical data of natural grassland grade in angqian county (1988). The data table structure is similar. For example, there are 9 fields in the statistical data (2012) of natural grassland grade area in Baoqian County: Field 1: Total Field 2: Level 1 Field 3: Level 2 Field 4: Level 3 Field 5: Level 4 Field 6: Level 5 Field 7:6 level Field 8: Level 7 Field 9: level 8
AGRICULTURAL AND RURAL Department of Qinghai Province
")
The data set records the statistical data of grassland type area and livestock carrying capacity in Baoqian County, Qinghai Province in 1988 and 2012. The data are classified and counted according to the grassland group code, such as: I represents Alpine dry grassland, II represents mountain dry grassland, III represents Alpine desert, B represents medium grass group, J represents shrub group, etc, For specific grassland group type codes and their corresponding meanings, see "description of grassland group type codes in Qinghai Province. PDF" in the data set. The data are compiled from the grassland station of Qinghai Province and the grassland resources statistics of Qinghai Province issued in 1988 and 2012. The data set contains three data tables, which are: grassland type area and livestock carrying capacity statistics of angqian county (1988), grassland type area and livestock carrying capacity statistics of Nangqian county (2012) and grassland group code description of Qinghai Province. The data table structure is similar. For example, there are 8 fields in the statistical data (2012) of grassland type, area and livestock carrying capacity in Nangqian County: Field 1: type code Field 2: grassland type name Field 3: grassland area Field 4: available area of grassland Field 5: average unit yield of fresh grass Field 6: average unit yield of edible fresh grass Field 7: stocking capacity Field 8: grassland type grade
AGRICULTURAL AND RURAL Department of Qinghai Province
")
The data set records the statistical data of natural grassland grade area in Minhe County, Qinghai Province in 1988 and 2012. The data are classified and counted according to the grade code of natural grassland. The grassland is divided into five grades: excellent, good, medium, low and poor with grassland type as the basic unit. The classification criteria of each grade are as follows: Grade I (excellent) Grassland: the weight of excellent forage accounts for more than 60%; Grade II (good grade) Grassland: the weight of grass above good grade accounts for more than 60%, and that of other types accounts for 40%; Grade III (medium) Grassland: the weight of forages above the medium category accounts for more than 60%, and that of other categories accounts for 40%; Grade IV (low) Grassland: the weight of grass above the low category accounts for more than 60%, and that of other categories accounts for 40%; Grade V (inferior) Grassland: the weight of inferior forage accounts for more than 40% The grassland level is divided into 8 levels according to the fresh grass yield. Standards at all levels are as follows: Level 1 Grassland: more than 12000k g of fresh grass per hectare of grassland; Level 2 Grassland: 9000kg ~ 12000kg fresh grass per hectare; Level 3 Grassland: 6000kg ~ 9000kg fresh grass per hectare; Level 4 Grassland: 4500kg ~ 6000kg fresh grass per hectare; Level 5 Grassland: 30001kg ~ 4500kg fresh grass per hectare; Grade 6 Grassland: 1500kg ~ 3000kg fresh grass per hectare; Grade 7 Grassland: 750KG ~ 1500kg fresh grass per hectare; Grade 8 Grassland: fresh grass per hectare is less than 750KG. The data are compiled from the grassland station of Qinghai Province and the grassland resources statistics of Qinghai Province issued in 1988 and 2012. The data set contains two data tables, namely: statistical data of natural grassland grade area in Minhe county (2012) and statistical data of natural grassland grade in Minhe county (1988). The data table structure is similar. For example, the statistical data of natural grassland grade area in Minhe county (2012) has 9 fields: Field 1: Total Field 2: Level 1 Field 3: Level 2 Field 4: Level 3 Field 5: Level 4 Field 6: Level 5 Field 7:6 level Field 8: Level 7 Field 9: level 8
AGRICULTURAL AND RURAL Department of Qinghai Province
")
The data set records the statistical data of grassland type area and livestock carrying capacity in Minhe County, Qinghai Province in 1988 and 2012. The data are classified and counted according to the grassland group code, such as: I represents Alpine dry grassland, II represents mountain dry grassland, III represents Alpine desert, B represents medium grass group, J represents shrub group, etc, For specific grassland group type codes and their corresponding meanings, see "description of grassland group type codes in Qinghai Province. PDF" in the data set. The data are compiled from the grassland station of Qinghai Province and the grassland resources statistics of Qinghai Province issued in 1988 and 2012. The data set contains three data tables, namely: grassland type area and livestock carrying capacity statistics of Minhe county (1988), grassland type area and livestock carrying capacity statistics of Minhe county (2012) and grassland group code description of Qinghai Province. The data table structure is similar. For example, there are 8 fields in the statistical data (2012) of grassland type, area and livestock carrying capacity in Minhe County: Field 1: type code Field 2: grassland type name Field 3: grassland area Field 4: available area of grassland Field 5: average unit yield of fresh grass Field 6: average unit yield of edible fresh grass Field 7: stocking capacity Field 8: grassland type grade
AGRICULTURAL AND RURAL Department of Qinghai Province
")
The data set records the statistical data of grassland type area and livestock carrying capacity in Menyuan County, Qinghai Province in 1988 and 2012. The data are classified and counted according to the grassland group code, such as: I represents Alpine dry grassland, II represents mountain dry grassland, III represents Alpine desert, B represents medium grass group, J represents shrub group, etc, For specific grassland group type codes and their corresponding meanings, see "description of grassland group type codes in Qinghai Province. PDF" in the data set. The data are compiled from the grassland station of Qinghai Province and the grassland resources statistics of Qinghai Province issued in 1988 and 2012. The data set contains three data tables, which are: grassland type area and livestock carrying capacity statistics of Menyuan County (1988), grassland type area and livestock carrying capacity statistics of Menyuan County (2012) and grassland group code description of Qinghai Province. The data table structure is similar. For example, there are 8 fields in the statistical data (2012) of grassland type, area and livestock carrying capacity in Menyuan County: Field 1: type code Field 2: grassland type name Field 3: grassland area Field 4: available area of grassland Field 5: average unit yield of fresh grass Field 6: average unit yield of edible fresh grass Field 7: stocking capacity Field 8: grassland type grade
AGRICULTURAL AND RURAL Department of Qinghai Province
")
The data set records the statistical data of natural grassland grade area in Menyuan County, Qinghai Province in 1988 and 2012. The data are classified and counted according to the grade code of natural grassland. The grassland is divided into five grades: excellent, good, medium, low and poor based on the grassland type. The classification criteria of each grade are as follows: Grade I (excellent) Grassland: the weight of excellent forage accounts for more than 60%; Grade II (good grade) Grassland: the weight of grass above good grade accounts for more than 60%, and that of other types accounts for 40%; Grade III (medium) Grassland: the weight of forages above the medium category accounts for more than 60%, and that of other categories accounts for 40%; Grade IV (low) Grassland: the weight of grass above the low category accounts for more than 60%, and that of other categories accounts for 40%; Grade V (inferior) Grassland: the weight of inferior forage accounts for more than 40% The grassland level is divided into 8 levels according to the fresh grass yield. Standards at all levels are as follows: Level 1 Grassland: more than 12000k g of fresh grass per hectare of grassland; Level 2 Grassland: 9000kg ~ 12000kg fresh grass per hectare; Level 3 Grassland: 6000kg ~ 9000kg fresh grass per hectare; Level 4 Grassland: 4500kg ~ 6000kg fresh grass per hectare; Level 5 Grassland: 30001kg ~ 4500kg fresh grass per hectare; Grade 6 Grassland: 1500kg ~ 3000kg fresh grass per hectare; Grade 7 Grassland: 750KG ~ 1500kg fresh grass per hectare; Grade 8 Grassland: fresh grass per hectare is less than 750KG. The data are compiled from the grassland station of Qinghai Province and the grassland resources statistics of Qinghai Province issued in 1988 and 2012. The data set contains two data tables, namely, the statistical data of natural grassland grade area in Menyuan County (2012) and the statistical data of natural grassland grade in Menyuan County (1988). The data table structure is similar. For example, there are 9 fields in the statistical data of natural grassland grade area in Menyuan County (2012): Field 1: Total Field 2: Level 1 Field 3: Level 2 Field 4: Level 3 Field 5: Level 4 Field 6: Level 5 Field 7:6 level Field 8: Level 7 Field 9: level 8
AGRICULTURAL AND RURAL Department of Qinghai Province
")
The data set records the statistical data of natural grassland grade area of Qinghai Mangya Administrative Committee in 1988 and 2012. The data are classified and counted according to the grade code of natural grassland. The grassland type is the basic unit and is divided into five grades: excellent, good, medium, low and poor. The classification criteria of each grade are as follows: Grade I (excellent) Grassland: the weight of excellent forage accounts for more than 60%; Grade II (good grade) Grassland: the weight of grass above good grade accounts for more than 60%, and that of other types accounts for 40%; Grade III (medium) Grassland: the weight of forages above the medium category accounts for more than 60%, and that of other categories accounts for 40%; Grade IV (low) Grassland: the weight of grass above the low category accounts for more than 60%, and that of other categories accounts for 40%; Grade V (inferior) Grassland: the weight of inferior forage accounts for more than 40% The grassland level is divided into 8 levels according to the fresh grass yield. Standards at all levels are as follows: Level 1 Grassland: more than 12000k g of fresh grass per hectare of grassland; Level 2 Grassland: 9000kg ~ 12000kg fresh grass per hectare; Level 3 Grassland: 6000kg ~ 9000kg fresh grass per hectare; Level 4 Grassland: 4500kg ~ 6000kg fresh grass per hectare; Level 5 Grassland: 30001kg ~ 4500kg fresh grass per hectare; Grade 6 Grassland: 1500kg ~ 3000kg fresh grass per hectare; Grade 7 Grassland: 750KG ~ 1500kg fresh grass per hectare; Grade 8 Grassland: fresh grass per hectare is less than 750KG. The data are compiled from the grassland station of Qinghai Province and the grassland resources statistics of Qinghai Province issued in 1988 and 2012. The data set contains two data tables, namely: statistical data of natural grassland grade area of Mangya Administrative Committee (2012) and statistical data of natural grassland grade in Mangya town (1988). The data table structure is similar. For example, there are 9 fields in the statistical data (2012) of natural grassland grade area of Mangya Administrative Committee: Field 1: Total Field 2: Level 1 Field 3: Level 2 Field 4: Level 3 Field 5: Level 4 Field 6: Level 5 Field 7:6 level Field 8: Level 7 Field 9: level 8
AGRICULTURAL AND RURAL Department of Qinghai Province
")
The data set records the statistical data of grassland type area and livestock carrying capacity of Mangya Administrative Committee of Qinghai Province in 1988 and 2012. The data are classified and counted according to the grassland group code, such as: I represents Alpine dry grassland, II represents mountain dry grassland, III represents Alpine desert, B represents medium grass group, J represents shrub group, etc, For specific grassland group type codes and their corresponding meanings, see "description of grassland group type codes in Qinghai Province. PDF" in the data set. The data are compiled from the grassland station of Qinghai Province and the grassland resources statistics of Qinghai Province issued in 1988 and 2012. The data set contains three data tables, namely: statistical data of grassland type area and livestock carrying capacity in Mangya town (1988), statistical data of grassland type area and livestock carrying capacity in Mangya Administrative Committee (2012) and code description of grassland type in Qinghai Province. The data table structure is similar. For example, there are 8 fields in the statistical data (2012) of grassland type, area and livestock carrying capacity of Mangya Administrative Committee: Field 1: type code Field 2: grassland type name Field 3: grassland area Field 4: available area of grassland Field 5: average unit yield of fresh grass Field 6: average unit yield of edible fresh grass Field 7: stocking capacity Field 8: grassland type grade
AGRICULTURAL AND RURAL Department of Qinghai Province
")
The data set records the statistical data of natural grassland grade area in Maqin County, Qinghai Province in 1988 and 2012. The data are classified and counted according to the grade code of natural grassland. The grassland is divided into five grades: excellent, good, medium, low and inferior with grassland type as the basic unit. The classification criteria of each grade are as follows: Grade I (excellent) Grassland: the weight of excellent forage accounts for more than 60%; Grade II (good grade) Grassland: the weight of grass above good grade accounts for more than 60%, and that of other types accounts for 40%; Grade III (medium) Grassland: the weight of forages above the medium category accounts for more than 60%, and that of other categories accounts for 40%; Grade IV (low) Grassland: the weight of grass above the low category accounts for more than 60%, and that of other categories accounts for 40%; Grade V (inferior) Grassland: the weight of inferior forage accounts for more than 40% The grassland level is divided into 8 levels according to the fresh grass yield. Standards at all levels are as follows: Level 1 Grassland: more than 12000k g of fresh grass per hectare of grassland; Level 2 Grassland: 9000kg ~ 12000kg fresh grass per hectare; Level 3 Grassland: 6000kg ~ 9000kg fresh grass per hectare; Level 4 Grassland: 4500kg ~ 6000kg fresh grass per hectare; Level 5 Grassland: 30001kg ~ 4500kg fresh grass per hectare; Grade 6 Grassland: 1500kg ~ 3000kg fresh grass per hectare; Grade 7 Grassland: 750KG ~ 1500kg fresh grass per hectare; Grade 8 Grassland: fresh grass per hectare is less than 750KG. The data are compiled from the grassland station of Qinghai Province and the grassland resources statistics of Qinghai Province issued in 1988 and 2012. The data set contains two data tables, namely, the grade area statistics of natural grassland in Maqin county (2012) and the grade statistics of natural grassland in Maqin county (1988). The data table structure is similar. For example, there are 9 fields in the statistical data of natural grassland grade area in Maqin county (2012): Field 1: Total Field 2: Level 1 Field 3: Level 2 Field 4: Level 3 Field 5: Level 4 Field 6: Level 5 Field 7:6 level Field 8: Level 7 Field 9: level 8
AGRICULTURAL AND RURAL Department of Qinghai Province
")
The data set records the statistical data of grassland type area and livestock carrying capacity in Maqin County, Qinghai Province in 1988 and 2012. The data are classified and counted according to the grassland group code, such as: I represents Alpine dry grassland, II represents mountain dry grassland, III represents Alpine desert, B represents medium grass group, J represents shrub group, etc, For specific grassland group type codes and their corresponding meanings, see "description of grassland group type codes in Qinghai Province. PDF" in the data set. The data are compiled from the grassland station of Qinghai Province and the grassland resources statistics of Qinghai Province issued in 1988 and 2012. The data set contains three data tables, which are: grassland type area and livestock carrying capacity statistics of Maqin county (1988), grassland type area and livestock carrying capacity statistics of Maqin county (2012) and grassland type code description of Qinghai Province. The data table structure is similar. For example, there are 8 fields in the statistical data (2012) of grassland type, area and livestock carrying capacity in Maqin County: Field 1: type code Field 2: grassland type name Field 3: grassland area Field 4: available area of grassland Field 5: average unit yield of fresh grass Field 6: average unit yield of edible fresh grass Field 7: stocking capacity Field 8: grassland type grade
AGRICULTURAL AND RURAL Department of Qinghai Province
")
The data set records the statistical data of natural grassland grade area in Maduo County, Qinghai Province in 1988 and 2012. The data are classified and counted according to the grade code of natural grassland. The grassland is divided into five grades: excellent, good, medium, low and inferior based on the grassland type. The classification criteria of each grade are as follows: Grade I (excellent) Grassland: the weight of excellent forage accounts for more than 60%; Grade II (good grade) Grassland: the weight of grass above good grade accounts for more than 60%, and that of other types accounts for 40%; Grade III (medium) Grassland: the weight of forages above the medium category accounts for more than 60%, and that of other categories accounts for 40%; Grade IV (low) Grassland: the weight of grass above the low category accounts for more than 60%, and that of other categories accounts for 40%; Grade V (inferior) Grassland: the weight of inferior forage accounts for more than 40% The grassland level is divided into 8 levels according to the fresh grass yield. Standards at all levels are as follows: Level 1 Grassland: more than 12000k g of fresh grass per hectare of grassland; Level 2 Grassland: 9000kg ~ 12000kg fresh grass per hectare; Level 3 Grassland: 6000kg ~ 9000kg fresh grass per hectare; Level 4 Grassland: 4500kg ~ 6000kg fresh grass per hectare; Level 5 Grassland: 30001kg ~ 4500kg fresh grass per hectare; Grade 6 Grassland: 1500kg ~ 3000kg fresh grass per hectare; Grade 7 Grassland: 750KG ~ 1500kg fresh grass per hectare; Grade 8 Grassland: fresh grass per hectare is less than 750KG. The data are compiled from the grassland station of Qinghai Province and the grassland resources statistics of Qinghai Province issued in 1988 and 2012. The data set contains two data tables, namely: Statistics of natural grassland grade area in Maduo County (2012) and statistics of natural grassland grade in Maduo County (1988). The data table structure is similar. For example, there are 9 fields in the statistical data of natural grassland grade area in Maduo County (2012): Field 1: Total Field 2: Level 1 Field 3: Level 2 Field 4: Level 3 Field 5: Level 4 Field 6: Level 5 Field 7:6 level Field 8: Level 7 Field 9: level 8
AGRICULTURAL AND RURAL Department of Qinghai Province
")
The data set records the statistical data of grassland type area and livestock carrying capacity in Maduo County, Qinghai Province in 1988 and 2012. The data are classified and counted according to the grassland group code, such as: I represents Alpine dry grassland, II represents mountain dry grassland, III represents Alpine desert, B represents medium grass group, J represents shrub group, etc, For specific grassland group type codes and their corresponding meanings, see "description of grassland group type codes in Qinghai Province. PDF" in the data set. The data are compiled from the grassland station of Qinghai Province and the grassland resources statistics of Qinghai Province issued in 1988 and 2012. The data set contains three data tables, namely: Statistics of grassland type area and livestock carrying capacity in Maduo County (1988), statistics of grassland type area and livestock carrying capacity in Maduo County (2012) and description of grassland group code in Qinghai Province. The data table structure is similar. For example, there are 8 fields in the statistical data (2012) of grassland type area and livestock carrying capacity in Maduo County: Field 1: type code Field 2: grassland type name Field 3: grassland area Field 4: available area of grassland Field 5: average unit yield of fresh grass Field 6: average unit yield of edible fresh grass Field 7: stocking capacity Field 8: grassland type grade
AGRICULTURAL AND RURAL Department of Qinghai Province
")
The data set records the statistical data of natural grassland grade area of Qinghai Lenghu Administrative Committee in 1988 and 2012. The data are classified and counted according to the grade code of natural grassland. The grassland type is the basic unit and is divided into five grades: excellent, good, medium, low and poor. The classification criteria of each grade are as follows: Grade I (excellent) Grassland: the weight of excellent forage accounts for more than 60%; Grade II (good grade) Grassland: the weight of grass above good grade accounts for more than 60%, and that of other types accounts for 40%; Grade III (medium) Grassland: the weight of forages above the medium category accounts for more than 60%, and that of other categories accounts for 40%; Grade IV (low) Grassland: the weight of grass above the low category accounts for more than 60%, and that of other categories accounts for 40%; Grade V (inferior) Grassland: the weight of inferior forage accounts for more than 40% The grassland level is divided into 8 levels according to the fresh grass yield. Standards at all levels are as follows: Level 1 Grassland: more than 12000k g of fresh grass per hectare of grassland; Level 2 Grassland: 9000kg ~ 12000kg fresh grass per hectare; Level 3 Grassland: 6000kg ~ 9000kg fresh grass per hectare; Level 4 Grassland: 4500kg ~ 6000kg fresh grass per hectare; Level 5 Grassland: 30001kg ~ 4500kg fresh grass per hectare; Grade 6 Grassland: 1500kg ~ 3000kg fresh grass per hectare; Grade 7 Grassland: 750KG ~ 1500kg fresh grass per hectare; Grade 8 Grassland: fresh grass per hectare is less than 750KG. The data are compiled from the grassland station of Qinghai Province and the grassland resources statistics of Qinghai Province issued in 1988 and 2012. The data set contains two data tables, namely, the statistical data of natural grassland grade area of Lenghu Administrative Committee (2012) and the statistical data of natural grassland grade of Lenghu (1988). The data table structure is similar. For example, the statistical data of natural grassland grade area of Lenghu Administrative Committee (2012) has 9 fields: Field 1: Total Field 2: Level 1 Field 3: Level 2 Field 4: Level 3 Field 5: Level 4 Field 6: Level 5 Field 7:6 level Field 8: Level 7 Field 9: level 8
AGRICULTURAL AND RURAL Department of Qinghai Province
")
The data set records the statistical data of grassland type area and livestock carrying capacity of Qinghai Lenghu Administrative Committee in 1988 and 2012. The data are classified and counted according to the grassland group code, such as: I represents Alpine dry grassland, II represents mountain dry grassland, III represents Alpine desert, B represents medium grass group, J represents shrub group, etc, For specific grassland group type codes and their corresponding meanings, see "description of grassland group type codes in Qinghai Province. PDF" in the data set. The data are compiled from the grassland station of Qinghai Province and the grassland resources statistics of Qinghai Province issued in 1988 and 2012. The data set contains three data tables, which are: statistical data of grassland type area and livestock carrying capacity in Lenghu town (1988), statistical data of grassland type area and livestock carrying capacity of Lenghu Administrative Committee (2012) and code description of grassland type in Qinghai Province. The data table structure is similar. For example, there are 8 fields in the statistical data (2012) of grassland type, area and livestock carrying capacity of Lenghu Administrative Committee: Field 1: type code Field 2: grassland type name Field 3: grassland area Field 4: available area of grassland Field 5: average unit yield of fresh grass Field 6: average unit yield of edible fresh grass Field 7: stocking capacity Field 8: grassland type grade
AGRICULTURAL AND RURAL Department of Qinghai Province
")
The data set records the statistical data of natural grassland grade area in Ledu County, Qinghai Province in 1988 and 2012. The data are classified and counted according to the grade code of natural grassland. The grassland is divided into five grades: excellent, good, medium, low and poor with grassland type as the basic unit. The classification criteria of each grade are as follows: Grade I (excellent) Grassland: the weight of excellent forage accounts for more than 60%; Grade II (good grade) Grassland: the weight of grass above good grade accounts for more than 60%, and that of other types accounts for 40%; Grade III (medium) Grassland: the weight of forages above the medium category accounts for more than 60%, and that of other categories accounts for 40%; Grade IV (low) Grassland: the weight of grass above the low category accounts for more than 60%, and that of other categories accounts for 40%; Grade V (inferior) Grassland: the weight of inferior forage accounts for more than 40% The grassland level is divided into 8 levels according to the fresh grass yield. Standards at all levels are as follows: Level 1 Grassland: more than 12000k g of fresh grass per hectare of grassland; Level 2 Grassland: 9000kg ~ 12000kg fresh grass per hectare; Level 3 Grassland: 6000kg ~ 9000kg fresh grass per hectare; Level 4 Grassland: 4500kg ~ 6000kg fresh grass per hectare; Level 5 Grassland: 30001kg ~ 4500kg fresh grass per hectare; Grade 6 Grassland: 1500kg ~ 3000kg fresh grass per hectare; Grade 7 Grassland: 750KG ~ 1500kg fresh grass per hectare; Grade 8 Grassland: fresh grass per hectare is less than 750KG. The data are compiled from the grassland station of Qinghai Province and the grassland resources statistics of Qinghai Province issued in 1988 and 2012. The data set contains two data tables, namely: Statistics of natural grassland grade area in Ledu County (2012) and statistics of natural grassland grade in Ledu County (1988). The data table structure is similar. For example, the statistical data of natural grassland grade area in Ledu County (2012) has 9 fields: Field 1: Total Field 2: Level 1 Field 3: Level 2 Field 4: Level 3 Field 5: Level 4 Field 6: Level 5 Field 7:6 level Field 8: Level 7 Field 9: level 8
AGRICULTURAL AND RURAL Department of Qinghai Province
")
The data set records the statistical data of grassland type area and livestock carrying capacity in Ledu County, Qinghai Province in 1988 and 2012. The data are classified and counted according to the grassland group code, such as: I represents Alpine dry grassland, II represents mountain dry grassland, III represents Alpine desert, B represents medium grass group, J represents shrub group, etc, For specific grassland group type codes and their corresponding meanings, see "description of grassland group type codes in Qinghai Province. PDF" in the data set. The data are compiled from the grassland station of Qinghai Province and the grassland resources statistics of Qinghai Province issued in 1988 and 2012. The data set contains three data tables, namely: statistical data of grassland type area and livestock carrying capacity in Ledu County (1988), statistical data of grassland type area and livestock carrying capacity in Ledu County (2012) and code description of grassland type in Qinghai Province. The data table structure is similar. For example, there are 8 fields in the statistical data (2012) of grassland type, area and livestock carrying capacity in Ledu County: Field 1: type code Field 2: grassland type name Field 3: grassland area Field 4: available area of grassland Field 5: average unit yield of fresh grass Field 6: average unit yield of edible fresh grass Field 7: stocking capacity Field 8: grassland type grade
AGRICULTURAL AND RURAL Department of Qinghai Province
")
The data set records the statistical data of natural grassland grade area in Jiuzhi County, Qinghai Province in 1988 and 2012. The data are classified and counted according to the grade code of natural grassland. The grassland is divided into five grades: excellent, good, medium, low and inferior based on the grassland type. The classification criteria of each grade are as follows: Grade I (excellent) Grassland: the weight of excellent forage accounts for more than 60%; Grade II (good grade) Grassland: the weight of grass above good grade accounts for more than 60%, and that of other types accounts for 40%; Grade III (medium) Grassland: the weight of forages above the medium category accounts for more than 60%, and that of other categories accounts for 40%; Grade IV (low) Grassland: the weight of grass above the low category accounts for more than 60%, and that of other categories accounts for 40%; Grade V (inferior) Grassland: the weight of inferior forage accounts for more than 40% The grassland level is divided into 8 levels according to the fresh grass yield. Standards at all levels are as follows: Level 1 Grassland: more than 12000k g of fresh grass per hectare of grassland; Level 2 Grassland: 9000kg ~ 12000kg fresh grass per hectare; Level 3 Grassland: 6000kg ~ 9000kg fresh grass per hectare; Level 4 Grassland: 4500kg ~ 6000kg fresh grass per hectare; Level 5 Grassland: 30001kg ~ 4500kg fresh grass per hectare; Grade 6 Grassland: 1500kg ~ 3000kg fresh grass per hectare; Grade 7 Grassland: 750KG ~ 1500kg fresh grass per hectare; Grade 8 Grassland: fresh grass per hectare is less than 750KG. The data are compiled from the grassland station of Qinghai Province and the grassland resources statistics of Qinghai Province issued in 1988 and 2012. The data set contains two data tables: statistical data of natural grassland grade area in Jiuzhi county (2012) and statistical data of natural grassland grade in Jiuzhi county (1988). The data table structure is similar. For example, the statistical data of natural grassland grade area in Jiuzhi county (2012) has 9 fields: Field 1: Total Field 2: Level 1 Field 3: Level 2 Field 4: Level 3 Field 5: Level 4 Field 6: Level 5 Field 7:6 level Field 8: Level 7 Field 9: level 8
AGRICULTURAL AND RURAL Department of Qinghai Province
")
The data set records the statistical data of grassland type area and livestock carrying capacity in Jiuzhi County, Qinghai Province in 1988 and 2012. The data are classified and counted according to the grassland group code, such as: I represents Alpine dry grassland, II represents mountain dry grassland, III represents Alpine desert, B represents medium grass group, J represents shrub group, etc, For specific grassland group type codes and their corresponding meanings, see "description of grassland group type codes in Qinghai Province. PDF" in the data set. The data are compiled from the grassland station of Qinghai Province and the grassland resources statistics of Qinghai Province issued in 1988 and 2012. The data set contains three data tables, namely: statistical data of grassland type area and livestock carrying capacity in Jiuzhi county (1988), statistical data of grassland type area and livestock carrying capacity in Jiuzhi county (2012) and code description of grassland type in Qinghai Province. The data table structure is similar. For example, there are 8 fields in the statistical data (2012) of grassland type, area and livestock carrying capacity in Jiuzhi County: Field 1: type code Field 2: grassland type name Field 3: grassland area Field 4: available area of grassland Field 5: average unit yield of fresh grass Field 6: average unit yield of edible fresh grass Field 7: stocking capacity Field 8: grassland type grade
AGRICULTURAL AND RURAL Department of Qinghai Province
")
The data set records the statistical data of natural grassland grade area in Jianzha County, Qinghai Province in 1988 and 2012. The data are classified and counted according to the grade code of natural grassland. The grassland is divided into five grades: excellent, good, medium, low and poor with grassland type as the basic unit. The classification criteria of each grade are as follows: Grade I (excellent) Grassland: the weight of excellent forage accounts for more than 60%; Grade II (good grade) Grassland: the weight of grass above good grade accounts for more than 60%, and that of other types accounts for 40%; Grade III (medium) Grassland: the weight of forages above the medium category accounts for more than 60%, and that of other categories accounts for 40%; Grade IV (low) Grassland: the weight of grass above the low category accounts for more than 60%, and that of other categories accounts for 40%; Grade V (inferior) Grassland: the weight of inferior forage accounts for more than 40% The grassland level is divided into 8 levels according to the fresh grass yield. Standards at all levels are as follows: Level 1 Grassland: more than 12000k g of fresh grass per hectare of grassland; Level 2 Grassland: 9000kg ~ 12000kg fresh grass per hectare; Level 3 Grassland: 6000kg ~ 9000kg fresh grass per hectare; Level 4 Grassland: 4500kg ~ 6000kg fresh grass per hectare; Level 5 Grassland: 30001kg ~ 4500kg fresh grass per hectare; Grade 6 Grassland: 1500kg ~ 3000kg fresh grass per hectare; Grade 7 Grassland: 750KG ~ 1500kg fresh grass per hectare; Grade 8 Grassland: fresh grass per hectare is less than 750KG. The data are compiled from the grassland station of Qinghai Province and the grassland resources statistics of Qinghai Province issued in 1988 and 2012. The data set contains two data tables, namely, the statistical data of natural grassland grade area in Jianzha county (2012) and the statistical data of natural grassland grade in Jianzha county (1988). The data table structure is similar. For example, there are 9 fields in the statistical data of natural grassland grade area in Jianzha county (2012): Field 1: Total Field 2: Level 1 Field 3: Level 2 Field 4: Level 3 Field 5: Level 4 Field 6: Level 5 Field 7:6 level Field 8: Level 7 Field 9: level 8
AGRICULTURAL AND RURAL Department of Qinghai Province
")
The data set records the statistical data of grassland type area and livestock carrying capacity in Jianzha County, Qinghai Province in 1988 and 2012. The data are classified and counted according to the grassland group code, such as: I represents Alpine dry grassland, II represents mountain dry grassland, III represents Alpine desert, B represents medium grass group, J represents shrub group, etc, For specific grassland group type codes and their corresponding meanings, see "description of grassland group type codes in Qinghai Province. PDF" in the data set. The data are compiled from the grassland station of Qinghai Province and the grassland resources statistics of Qinghai Province issued in 1988 and 2012. The data set contains three data tables, namely: grassland type area and livestock carrying capacity statistics of Jianzha county (1988), grassland type area and livestock carrying capacity statistics of Jianzha county (2012) and grassland group code description of Qinghai Province. The data table structure is similar. For example, there are 8 fields in the statistical data (2012) of grassland type, area and livestock carrying capacity in Jianzha County: Field 1: type code Field 2: grassland type name Field 3: grassland area Field 4: available area of grassland Field 5: average unit yield of fresh grass Field 6: average unit yield of edible fresh grass Field 7: stocking capacity Field 8: grassland type grade
AGRICULTURAL AND RURAL Department of Qinghai Province
")
The data set records the statistical data of natural grassland grade area in Huangzhong County, Qinghai Province in 1988 and 2012. The data are classified and counted according to the grade code of natural grassland. The grassland is divided into five grades: excellent, good, medium, low and poor with grassland type as the basic unit. The classification criteria of each grade are as follows: Grade I (excellent) Grassland: the weight of excellent forage accounts for more than 60%; Grade II (good grade) Grassland: the weight of grass above good grade accounts for more than 60%, and that of other types accounts for 40%; Grade III (medium) Grassland: the weight of forages above the medium category accounts for more than 60%, and that of other categories accounts for 40%; Grade IV (low) Grassland: the weight of grass above the low category accounts for more than 60%, and that of other categories accounts for 40%; Grade V (inferior) Grassland: the weight of inferior forage accounts for more than 40% The grassland level is divided into 8 levels according to the fresh grass yield. Standards at all levels are as follows: Level 1 Grassland: more than 12000k g of fresh grass per hectare of grassland; Level 2 Grassland: 9000kg ~ 12000kg fresh grass per hectare; Level 3 Grassland: 6000kg ~ 9000kg fresh grass per hectare; Level 4 Grassland: 4500kg ~ 6000kg fresh grass per hectare; Level 5 Grassland: 30001kg ~ 4500kg fresh grass per hectare; Grade 6 Grassland: 1500kg ~ 3000kg fresh grass per hectare; Grade 7 Grassland: 750KG ~ 1500kg fresh grass per hectare; Grade 8 Grassland: fresh grass per hectare is less than 750KG. The data are compiled from the grassland station of Qinghai Province and the grassland resources statistics of Qinghai Province issued in 1988 and 2012. The data set contains two data tables, namely, the statistical data of natural grassland grade area in Huangzhong County (2012) and the statistical data of natural grassland grade in Huangzhong County (1988). The data table structure is similar. For example, the statistical data of natural grassland grade area in Huangzhong County (2012) has 9 fields: Field 1: Total Field 2: Level 1 Field 3: Level 2 Field 4: Level 3 Field 5: Level 4 Field 6: Level 5 Field 7:6 level Field 8: Level 7 Field 9: level 8
AGRICULTURAL AND RURAL Department of Qinghai Province
")
The data set records the statistical data of grassland type area and livestock carrying capacity in Huangzhong County, Qinghai Province in 1988 and 2012. The data are classified and counted according to the grassland group code, such as: I represents Alpine dry grassland, II represents mountain dry grassland, III represents Alpine desert, B represents medium grass group, J represents shrub group, etc, For specific grassland group type codes and their corresponding meanings, see "description of grassland group type codes in Qinghai Province. PDF" in the data set. The data are compiled from the grassland station of Qinghai Province and the grassland resources statistics of Qinghai Province issued in 1988 and 2012. The data set contains three data tables, which are: grassland type area and livestock carrying capacity statistics of Huangzhong County (1988), grassland type area and livestock carrying capacity statistics of Huangzhong County (2012) and grassland type code description of Qinghai Province. The data table structure is similar. For example, there are 8 fields in the statistical data (2012) of grassland type, area and livestock carrying capacity in Huangzhong County: Field 1: type code Field 2: grassland type name Field 3: grassland area Field 4: available area of grassland Field 5: average unit yield of fresh grass Field 6: average unit yield of edible fresh grass Field 7: stocking capacity Field 8: grassland type grade
AGRICULTURAL AND RURAL Department of Qinghai Province
")
The data set records the statistical data of natural grassland grade area in Huangyuan County, Qinghai Province in 1988 and 2012. The data are classified and counted according to the grade code of natural grassland. The grassland is divided into five grades: excellent, good, medium, low and inferior based on the grassland type. The classification criteria of each grade are as follows: Grade I (excellent) Grassland: the weight of excellent forage accounts for more than 60%; Grade II (good grade) Grassland: the weight of grass above good grade accounts for more than 60%, and that of other types accounts for 40%; Grade III (medium) Grassland: the weight of forages above the medium category accounts for more than 60%, and that of other categories accounts for 40%; Grade IV (low) Grassland: the weight of grass above the low category accounts for more than 60%, and that of other categories accounts for 40%; Grade V (inferior) Grassland: the weight of inferior forage accounts for more than 40% The grassland level is divided into 8 levels according to the fresh grass yield. Standards at all levels are as follows: Level 1 Grassland: more than 12000k g of fresh grass per hectare of grassland; Level 2 Grassland: 9000kg ~ 12000kg fresh grass per hectare; Level 3 Grassland: 6000kg ~ 9000kg fresh grass per hectare; Level 4 Grassland: 4500kg ~ 6000kg fresh grass per hectare; Level 5 Grassland: 30001kg ~ 4500kg fresh grass per hectare; Grade 6 Grassland: 1500kg ~ 3000kg fresh grass per hectare; Grade 7 Grassland: 750KG ~ 1500kg fresh grass per hectare; Grade 8 Grassland: fresh grass per hectare is less than 750KG. The data are compiled from the grassland station of Qinghai Province and the grassland resources statistics of Qinghai Province issued in 1988 and 2012. The data set contains two data tables, namely, the statistical data of natural grassland grade area in Huangyuan county (2012) and the statistical data of natural grassland grade in Huangyuan county (1988). The data table structure is similar. For example, there are 9 fields in the statistical data of natural grassland grade area in Huangyuan county (2012): Field 1: Total Field 2: Level 1 Field 3: Level 2 Field 4: Level 3 Field 5: Level 4 Field 6: Level 5 Field 7:6 level Field 8: Level 7 Field 9: level 8
AGRICULTURAL AND RURAL Department of Qinghai Province
")
The data set records the statistical data of grassland type area and livestock carrying capacity in Huangyuan County, Qinghai Province in 1988 and 2012. The data are classified and counted according to the grassland group code, such as: I represents Alpine dry grassland, II represents mountain dry grassland, III represents Alpine desert, B represents medium grass group, J represents shrub group, etc, For specific grassland group type codes and their corresponding meanings, see "description of grassland group type codes in Qinghai Province. PDF" in the data set. The data are compiled from the grassland station of Qinghai Province and the grassland resources statistics of Qinghai Province issued in 1988 and 2012. The data set contains three data tables, namely: grassland type area and livestock carrying capacity statistics of Huangyuan county (1988), grassland type area and livestock carrying capacity statistics of Huangyuan county (2012) and grassland group code description of Qinghai Province. The data table structure is similar. For example, there are 8 fields in the statistical data (2012) of grassland type, area and livestock carrying capacity in Huangyuan County: Field 1: type code Field 2: grassland type name Field 3: grassland area Field 4: available area of grassland Field 5: average unit yield of fresh grass Field 6: average unit yield of edible fresh grass Field 7: stocking capacity Field 8: grassland type grade
AGRICULTURAL AND RURAL Department of Qinghai Province
")
The data set records the statistical data of natural grassland grade area in Huangnan Prefecture, Qinghai Province in 1988 and 2012. The data are classified and counted according to the grade code of natural grassland. The grassland is divided into five grades: excellent, good, medium, low and poor based on the grassland type. The classification criteria of each grade are as follows: Grade I (excellent) Grassland: the weight of excellent forage accounts for more than 60%; Grade II (good grade) Grassland: the weight of grass above good grade accounts for more than 60%, and that of other types accounts for 40%; Grade III (medium) Grassland: the weight of forages above the medium category accounts for more than 60%, and that of other categories accounts for 40%; Grade IV (low) Grassland: the weight of grass above the low category accounts for more than 60%, and that of other categories accounts for 40%; Grade V (inferior) Grassland: the weight of inferior forage accounts for more than 40% The grassland level is divided into 8 levels according to the fresh grass yield. Standards at all levels are as follows: Level 1 Grassland: more than 12000k g of fresh grass per hectare of grassland; Level 2 Grassland: 9000kg ~ 12000kg fresh grass per hectare; Level 3 Grassland: 6000kg ~ 9000kg fresh grass per hectare; Level 4 Grassland: 4500kg ~ 6000kg fresh grass per hectare; Level 5 Grassland: 30001kg ~ 4500kg fresh grass per hectare; Grade 6 Grassland: 1500kg ~ 3000kg fresh grass per hectare; Grade 7 Grassland: 750KG ~ 1500kg fresh grass per hectare; Grade 8 Grassland: fresh grass per hectare is less than 750KG. The data are compiled from the grassland station of Qinghai Province and the grassland resources statistics of Qinghai Province issued in 1988 and 2012. The data set contains two data tables, namely: Statistics of natural grassland grade area in Huangnan prefecture (2012) and statistics of natural grassland grade in Huangnan Tibetan Autonomous Prefecture (1988). The data table structure is similar. For example, there are 9 fields in the statistical data of natural grassland grade area in Huangnan prefecture (2012): Field 1: Total Field 2: Level 1 Field 3: Level 2 Field 4: Level 3 Field 5: Level 4 Field 6: Level 5 Field 7:6 level Field 8: Level 7 Field 9: level 8
AGRICULTURAL AND RURAL Department of Qinghai Province
")
The data set records the statistical data of grassland type area and livestock carrying capacity in Huangnan Prefecture, Qinghai Province in 1988 and 2012. The data are classified and counted according to the grassland group code, such as: I represents Alpine dry grassland, II represents mountain dry grassland, III represents Alpine desert, B represents medium grass group, J represents shrub group, etc, For specific grassland group type codes and their corresponding meanings, see "description of grassland group type codes in Qinghai Province. PDF" in the data set. The data are compiled from the grassland station of Qinghai Province and the grassland resources statistics of Qinghai Province issued in 1988 and 2012. The data set contains three data tables, which are: statistical data of grassland area and livestock carrying capacity of various types in Huangnan Tibetan Autonomous Prefecture (1988), statistical data of grassland area and livestock carrying capacity in Huangnan prefecture (2012) and code description of grassland types in Qinghai Province. The data table structure is similar. For example, there are 8 fields in the statistical data (2012) of grassland type, area and livestock carrying capacity in Huangnan Prefecture: Field 1: type code Field 2: grassland type name Field 3: grassland area Field 4: available area of grassland Field 5: average unit yield of fresh grass Field 6: average unit yield of edible fresh grass Field 7: stocking capacity Field 8: grassland type, etc
AGRICULTURAL AND RURAL Department of Qinghai Province
")
The data set records the statistical data of natural grassland grade area in Hualong County, Qinghai Province in 1988 and 2012. The data are classified and counted according to the grade code of natural grassland. The grassland is divided into five grades: excellent, good, medium, low and poor based on the grassland type. The classification criteria of each grade are as follows: Grade I (excellent) Grassland: the weight of excellent forage accounts for more than 60%; Grade II (good grade) Grassland: the weight of grass above good grade accounts for more than 60%, and that of other types accounts for 40%; Grade III (medium) Grassland: the weight of forages above the medium category accounts for more than 60%, and that of other categories accounts for 40%; Grade IV (low) Grassland: the weight of grass above the low category accounts for more than 60%, and that of other categories accounts for 40%; Grade V (inferior) Grassland: the weight of inferior forage accounts for more than 40% The grassland level is divided into 8 levels according to the fresh grass yield. Standards at all levels are as follows: Level 1 Grassland: more than 12000k g of fresh grass per hectare of grassland; Level 2 Grassland: 9000kg ~ 12000kg fresh grass per hectare; Level 3 Grassland: 6000kg ~ 9000kg fresh grass per hectare; Level 4 Grassland: 4500kg ~ 6000kg fresh grass per hectare; Level 5 Grassland: 30001kg ~ 4500kg fresh grass per hectare; Grade 6 Grassland: 1500kg ~ 3000kg fresh grass per hectare; Grade 7 Grassland: 750KG ~ 1500kg fresh grass per hectare; Grade 8 Grassland: fresh grass per hectare is less than 750KG. The data are compiled from the grassland station of Qinghai Province and the grassland resources statistics of Qinghai Province issued in 1988 and 2012. The data set contains two data tables: statistical data of natural grassland grade area in Hualong county (2012) and statistical data of natural grassland grade in Hualong county (1988). The data table structure is similar. For example, the statistical data of natural grassland grade area in Hualong county (2012) has 9 fields: Field 1: Total Field 2: Level 1 Field 3: Level 2 Field 4: Level 3 Field 5: Level 4 Field 6: Level 5 Field 7:6 level Field 8: Level 7 Field 9: level 8
AGRICULTURAL AND RURAL Department of Qinghai Province
")
The data set records the statistical data of grassland type area and livestock carrying capacity in Hualong County, Qinghai Province in 1988 and 2012. The data are classified and counted according to the grassland group code, such as: I represents Alpine dry grassland, II represents mountain dry grassland, III represents Alpine desert, B represents medium grass group, J represents shrub group, etc, For specific grassland group type codes and their corresponding meanings, see "description of grassland group type codes in Qinghai Province. PDF" in the data set. The data are compiled from the grassland station of Qinghai Province and the grassland resources statistics of Qinghai Province issued in 1988 and 2012. The data set contains three data tables, namely: statistical data of grassland type area and livestock carrying capacity in Hualong county (1988), statistical data of grassland type area and livestock carrying capacity in Hualong county (2012) and code description of grassland type in Qinghai Province. The data table structure is similar. For example, there are 8 fields in the statistical data (2012) of grassland type, area and livestock carrying capacity in Hualong County: Field 1: type code Field 2: grassland type name Field 3: grassland area Field 4: available area of grassland Field 5: average unit yield of fresh grass Field 6: average unit yield of edible fresh grass Field 7: stocking capacity Field 8: grassland type grade
AGRICULTURAL AND RURAL Department of Qinghai Province
")
The data set records the statistical data of natural grassland grade area in Huzhu County, Qinghai Province in 1988 and 2012. The data are classified and counted according to the grade code of natural grassland. The grassland is divided into five grades: excellent, good, medium, low and poor with grassland type as the basic unit. The classification criteria of each grade are as follows: Grade I (excellent) Grassland: the weight of excellent forage accounts for more than 60%; Grade II (good grade) Grassland: the weight of grass above good grade accounts for more than 60%, and that of other types accounts for 40%; Grade III (medium) Grassland: the weight of forages above the medium category accounts for more than 60%, and that of other categories accounts for 40%; Grade IV (low) Grassland: the weight of grass above the low category accounts for more than 60%, and that of other categories accounts for 40%; Grade V (inferior) Grassland: the weight of inferior forage accounts for more than 40% The grassland level is divided into 8 levels according to the fresh grass yield. Standards at all levels are as follows: Level 1 Grassland: more than 12000k g of fresh grass per hectare of grassland; Level 2 Grassland: 9000kg ~ 12000kg fresh grass per hectare; Level 3 Grassland: 6000kg ~ 9000kg fresh grass per hectare; Level 4 Grassland: 4500kg ~ 6000kg fresh grass per hectare; Level 5 Grassland: 30001kg ~ 4500kg fresh grass per hectare; Grade 6 Grassland: 1500kg ~ 3000kg fresh grass per hectare; Grade 7 Grassland: 750KG ~ 1500kg fresh grass per hectare; Grade 8 Grassland: fresh grass per hectare is less than 750KG. The data are compiled from the grassland station of Qinghai Province and the grassland resources statistics of Qinghai Province issued in 1988 and 2012. The data set contains two data tables, namely: statistical data of natural grassland grade area in Huzhu county (2012) and statistical data of natural grassland grade in Huzhu county (1988). The data table structure is similar. For example, the statistical data of natural grassland grade area in Huzhu county (2012) has 9 fields: Field 1: Total Field 2: Level 1 Field 3: Level 2 Field 4: Level 3 Field 5: Level 4 Field 6: Level 5 Field 7:6 level Field 8: Level 7 Field 9: level 8
AGRICULTURAL AND RURAL Department of Qinghai Province
")
The data set records the statistical data of grassland type area and livestock carrying capacity in Huzhu County, Qinghai Province in 1988 and 2012. The data are classified and counted according to the grassland group code, such as: I represents Alpine dry grassland, II represents mountain dry grassland, III represents Alpine desert, B represents medium grass group, J represents shrub group, etc, For specific grassland group type codes and their corresponding meanings, see "description of grassland group type codes in Qinghai Province. PDF" in the data set. The data are compiled from the grassland station of Qinghai Province and the grassland resources statistics of Qinghai Province issued in 1988 and 2012. The data set contains three data tables, namely: statistical data of grassland type area and livestock carrying capacity in Huzhu county (1988), statistical data of grassland type area and livestock carrying capacity in Huzhu county (2012) and code description of grassland type in Qinghai Province. The data table structure is similar. For example, there are 8 fields in the statistical data (2012) of grassland type, area and livestock carrying capacity in Huzhu County: Field 1: type code Field 2: grassland type name Field 3: grassland area Field 4: available area of grassland Field 5: average unit yield of fresh grass Field 6: average unit yield of edible fresh grass Field 7: stocking capacity Field 8: grassland type grade
AGRICULTURAL AND RURAL Department of Qinghai Province
")
The data set records the statistical data of natural grassland grade area in Henan County, Qinghai Province in 1988 and 2012. The data are classified and counted according to the grade code of natural grassland. The grassland is divided into five grades: excellent, good, medium, low and poor with grassland type as the basic unit. The classification criteria of each grade are as follows: Grade I (excellent) Grassland: the weight of excellent forage accounts for more than 60%; Grade II (good grade) Grassland: the weight of grass above good grade accounts for more than 60%, and that of other types accounts for 40%; Grade III (medium) Grassland: the weight of forages above the medium category accounts for more than 60%, and that of other categories accounts for 40%; Grade IV (low) Grassland: the weight of grass above the low category accounts for more than 60%, and that of other categories accounts for 40%; Grade V (inferior) Grassland: the weight of inferior forage accounts for more than 40% The grassland level is divided into 8 levels according to the fresh grass yield. Standards at all levels are as follows: Level 1 Grassland: more than 12000k g of fresh grass per hectare of grassland; Level 2 Grassland: 9000kg ~ 12000kg fresh grass per hectare; Level 3 Grassland: 6000kg ~ 9000kg fresh grass per hectare; Level 4 Grassland: 4500kg ~ 6000kg fresh grass per hectare; Level 5 Grassland: 30001kg ~ 4500kg fresh grass per hectare; Grade 6 Grassland: 1500kg ~ 3000kg fresh grass per hectare; Grade 7 Grassland: 750KG ~ 1500kg fresh grass per hectare; Grade 8 Grassland: fresh grass per hectare is less than 750KG. The data are compiled from the grassland station of Qinghai Province and the grassland resources statistics of Qinghai Province issued in 1988 and 2012. The data set contains two data tables, namely: statistical data of natural grassland grade area in Henan county (2012) and statistical data of natural grassland grade in Henan county (1988). The data table structure is similar. For example, the statistical data of natural grassland grade area in Henan county (2012) has 9 fields: Field 1: Total Field 2: Level 1 Field 3: Level 2 Field 4: Level 3 Field 5: Level 4 Field 6: Level 5 Field 7:6 level Field 8: Level 7 Field 9: level 8
AGRICULTURAL AND RURAL Department of Qinghai Province
")
The data set records the statistical data of grassland type area and livestock carrying capacity in Henan County, Qinghai Province in 1988 and 2012. The data are classified and counted according to the grassland group code, such as: I represents Alpine dry grassland, II represents mountain dry grassland, III represents Alpine desert, B represents medium grass group, J represents shrub group, etc, For specific grassland group type codes and their corresponding meanings, see "description of grassland group type codes in Qinghai Province. PDF" in the data set. The data are compiled from the grassland station of Qinghai Province and the grassland resources statistics of Qinghai Province issued in 1988 and 2012. The data set contains three data tables, namely: statistical data of grassland type area and livestock carrying capacity in Henan county (1988), statistical data of grassland type area and livestock carrying capacity in Henan county (2012) and code description of grassland type in Qinghai Province. The data table structure is similar. For example, there are 8 fields in the statistical data (2012) of grassland type area and livestock carrying capacity in Henan County: Field 1: type code Field 2: grassland type name Field 3: grassland area Field 4: available area of grassland Field 5: average unit yield of fresh grass Field 6: average unit yield of edible fresh grass Field 7: stocking capacity Field 8: grassland type grade
AGRICULTURAL AND RURAL Department of Qinghai Province
")
The data set records the statistical data of natural grassland grade area in Haiyan County, Qinghai Province in 1988 and 2012. The data are classified and counted according to the grade code of natural grassland. The grassland type is the basic unit and is divided into five grades: excellent, good, medium, low and poor. The classification criteria of each grade are as follows: Grade I (excellent) Grassland: the weight of excellent forage accounts for more than 60%; Grade II (good grade) Grassland: the weight of grass above good grade accounts for more than 60%, and that of other types accounts for 40%; Grade III (medium) Grassland: the weight of forages above the medium category accounts for more than 60%, and that of other categories accounts for 40%; Grade IV (low) Grassland: the weight of grass above the low category accounts for more than 60%, and that of other categories accounts for 40%; Grade V (inferior) Grassland: the weight of inferior forage accounts for more than 40% The grassland level is divided into 8 levels according to the fresh grass yield. Standards at all levels are as follows: Level 1 Grassland: more than 12000k g of fresh grass per hectare of grassland; Level 2 Grassland: 9000kg ~ 12000kg fresh grass per hectare; Level 3 Grassland: 6000kg ~ 9000kg fresh grass per hectare; Level 4 Grassland: 4500kg ~ 6000kg fresh grass per hectare; Level 5 Grassland: 30001kg ~ 4500kg fresh grass per hectare; Grade 6 Grassland: 1500kg ~ 3000kg fresh grass per hectare; Grade 7 Grassland: 750KG ~ 1500kg fresh grass per hectare; Grade 8 Grassland: fresh grass per hectare is less than 750KG. The data are compiled from the grassland station of Qinghai Province and the grassland resources statistics of Qinghai Province issued in 1988 and 2012. The data set contains two data tables, namely: statistical data of natural grassland grade area in Haiyan County (2012) and statistical data of natural grassland grade in Haiyan County (1988). The data table structure is similar. For example, the statistical data of natural grassland grade area in Haiyan County (2012) has 9 fields: Field 1: Total Field 2: Level 1 Field 3: Level 2 Field 4: Level 3 Field 5: Level 4 Field 6: Level 5 Field 7:6 level Field 8: Level 7 Field 9: level 8
AGRICULTURAL AND RURAL Department of Qinghai Province
")
The data set records the statistical data of grassland type area and livestock carrying capacity in Haiyan County, Qinghai Province in 1988 and 2012. The data are classified and counted according to the grassland group code, such as: I represents Alpine dry grassland, II represents mountain dry grassland, III represents Alpine desert, B represents medium grass group, J represents shrub group, etc, For specific grassland group type codes and their corresponding meanings, see "description of grassland group type codes in Qinghai Province. PDF" in the data set. The data are compiled from the grassland station of Qinghai Province and the grassland resources statistics of Qinghai Province issued in 1988 and 2012. The data set contains three data tables, namely: statistical data of grassland type area and livestock carrying capacity in Haiyan County (1988), statistical data of grassland type area and livestock carrying capacity in Haiyan County (2012) and code description of grassland type in Qinghai Province. The data table structure is similar. For example, there are 8 fields in the statistical data (2012) of grassland type, area and livestock carrying capacity in Haiyan County: Field 1: type code Field 2: grassland type name Field 3: grassland area Field 4: available area of grassland Field 5: average unit yield of fresh grass Field 6: average unit yield of edible fresh grass Field 7: stocking capacity Field 8: grassland type grade
AGRICULTURAL AND RURAL Department of Qinghai Province
")
The data set records the statistical data of natural grassland grade area in Haixi Prefecture, Qinghai Province in 1988 and 2012. The data are classified and counted according to the grade code of natural grassland. The grassland is divided into five grades: excellent, good, medium, low and poor with grassland type as the basic unit. The classification criteria of each grade are as follows: Grade I (excellent) Grassland: the weight of excellent forage accounts for more than 60%; Grade II (good grade) Grassland: the weight of grass above good grade accounts for more than 60%, and that of other types accounts for 40%; Grade III (medium) Grassland: the weight of forages above the medium category accounts for more than 60%, and that of other categories accounts for 40%; Grade IV (low) Grassland: the weight of grass above the low category accounts for more than 60%, and that of other categories accounts for 40%; Grade V (inferior) Grassland: the weight of inferior forage accounts for more than 40% The grassland level is divided into 8 levels according to the fresh grass yield. Standards at all levels are as follows: Level 1 Grassland: more than 12000k g of fresh grass per hectare of grassland; Level 2 Grassland: 9000kg ~ 12000kg fresh grass per hectare; Level 3 Grassland: 6000kg ~ 9000kg fresh grass per hectare; Level 4 Grassland: 4500kg ~ 6000kg fresh grass per hectare; Level 5 Grassland: 30001kg ~ 4500kg fresh grass per hectare; Grade 6 Grassland: 1500kg ~ 3000kg fresh grass per hectare; Grade 7 Grassland: 750KG ~ 1500kg fresh grass per hectare; Grade 8 Grassland: fresh grass per hectare is less than 750KG. The data are compiled from the grassland station of Qinghai Province and the grassland resources statistics of Qinghai Province issued in 1988 and 2012. The data set contains two data tables, namely: statistical data of natural grassland grade area in Haixi prefecture (2012) and statistical data of natural grassland grade in Haixi Mongolian and Tibetan Autonomous Prefecture (1988). The data table structure is similar. For example, there are 9 fields in the statistical data of natural grassland grade area in Haixi prefecture (2012): Field 1: Total Field 2: Level 1 Field 3: Level 2 Field 4: Level 3 Field 5: Level 4 Field 6: Level 5 Field 7:6 level Field 8: Level 7 Field 9: level 8
AGRICULTURAL AND RURAL Department of Qinghai Province
")
The data set records the statistical data of grassland type area and livestock carrying capacity in Haixi Prefecture of Qinghai Province in 1988 and 2012. The data are classified and counted according to the grassland group code, such as: I represents Alpine dry grassland, II represents mountain dry grassland, III represents Alpine desert, B represents medium grass group, J represents shrub group, etc, For specific grassland group type codes and their corresponding meanings, see "description of grassland group type codes in Qinghai Province. PDF" in the data set. The data are compiled from the grassland station of Qinghai Province and the grassland resources statistics of Qinghai Province issued in 1988 and 2012. The data set contains three data tables, namely: statistical data of grassland area and livestock carrying capacity of various types in Haixi Mongolian and Tibetan Autonomous Prefecture (1988), statistical data of grassland area and livestock carrying capacity in Haixi prefecture (2012) and description of grassland group code in Qinghai Province. The data table structure is similar. There are 8 fields in the statistical data (2012) of grassland type, area and livestock carrying capacity in Haixi Prefecture: Field 1: type code Field 2: grassland type name Field 3: grassland area Field 4: available area of grassland Field 5: average unit yield of fresh grass Field 6: average unit yield of edible fresh grass Field 7: stocking capacity Field 8: grassland type, etc
AGRICULTURAL AND RURAL Department of Qinghai Province
")
The data set records the statistical data of natural grassland grade area in Hainan prefecture, Qinghai Province in 1988 and 2012. The data are classified and counted according to the grade code of natural grassland. The grassland is divided into five grades: excellent, good, medium, low and poor with grassland type as the basic unit. The classification criteria of each grade are as follows: Grade I (excellent) Grassland: the weight of excellent forage accounts for more than 60%; Grade II (good grade) Grassland: the weight of grass above good grade accounts for more than 60%, and that of other types accounts for 40%; Grade III (medium) Grassland: the weight of forages above the medium category accounts for more than 60%, and that of other categories accounts for 40%; Grade IV (low) Grassland: the weight of grass above the low category accounts for more than 60%, and that of other categories accounts for 40%; Grade V (inferior) Grassland: the weight of inferior forage accounts for more than 40% The grassland level is divided into 8 levels according to the fresh grass yield. Standards at all levels are as follows: Level 1 Grassland: more than 12000k g of fresh grass per hectare of grassland; Level 2 Grassland: 9000kg ~ 12000kg fresh grass per hectare; Level 3 Grassland: 6000kg ~ 9000kg fresh grass per hectare; Level 4 Grassland: 4500kg ~ 6000kg fresh grass per hectare; Level 5 Grassland: 30001kg ~ 4500kg fresh grass per hectare; Grade 6 Grassland: 1500kg ~ 3000kg fresh grass per hectare; Grade 7 Grassland: 750KG ~ 1500kg fresh grass per hectare; Grade 8 Grassland: fresh grass per hectare is less than 750KG. The data are compiled from the grassland station of Qinghai Province and the grassland resources statistics of Qinghai Province issued in 1988 and 2012. The data set contains two data tables, namely, the statistical data of natural grassland grade area in Hainan prefecture (2012) and the statistical data of natural grassland grade in Hainan Tibetan Autonomous Prefecture (1988). The data table structure is similar. For example, the statistical data of natural grassland grade area in Hainan (2012) has 9 fields: Field 1: Total Field 2: Level 1 Field 3: Level 2 Field 4: Level 3 Field 5: Level 4 Field 6: Level 5 Field 7:6 level Field 8: Level 7 Field 9: level 8
AGRICULTURAL AND RURAL Department of Qinghai Province
")
The data set records the statistical data of grassland type area and livestock carrying capacity in Hainan prefecture of Qinghai Province in 1988 and 2012. The data are classified and counted according to the grassland group code, such as: I represents Alpine dry grassland, II represents mountain dry grassland, III represents Alpine desert, B represents medium grass group, J represents shrub group, etc, For specific grassland group type codes and their corresponding meanings, see "description of grassland group type codes in Qinghai Province. PDF" in the data set. The data are compiled from the grassland station of Qinghai Province and the grassland resources statistics of Qinghai Province issued in 1988 and 2012. The data set contains three data tables, namely: statistical data of grassland area and livestock carrying capacity of various types in Hainan Tibetan Autonomous Prefecture (1988), statistical data of grassland area and livestock carrying capacity in Hainan prefecture (2012) and description of grassland group code in Qinghai Province. The data table structure is similar. There are 8 fields in the statistical data of grassland type area and livestock carrying capacity in Hainan (2012): Field 1: type code Field 2: grassland type name Field 3: grassland area Field 4: available area of grassland Field 5: average unit yield of fresh grass Field 6: average unit yield of edible fresh grass Field 7: stocking capacity Field 8: grassland type, etc
AGRICULTURAL AND RURAL Department of Qinghai Province
")
The data set records the statistical data of natural grassland grade area in Haidong area of Qinghai Province in 1988 and 2012. The data are classified and counted according to the grade code of natural grassland. The grassland is divided into five grades: excellent, good, medium, low and inferior based on the grassland type. The classification criteria of each grade are as follows: Grade I (excellent) Grassland: the weight of excellent forage accounts for more than 60%; Grade II (good grade) Grassland: the weight of grass above good grade accounts for more than 60%, and that of other types accounts for 40%; Grade III (medium) Grassland: the weight of forages above the medium category accounts for more than 60%, and that of other categories accounts for 40%; Grade IV (low) Grassland: the weight of grass above the low category accounts for more than 60%, and that of other categories accounts for 40%; Grade V (inferior) Grassland: the weight of inferior forage accounts for more than 40% The grassland level is divided into 8 levels according to the fresh grass yield. Standards at all levels are as follows: Level 1 Grassland: more than 12000k g of fresh grass per hectare of grassland; Level 2 Grassland: 9000kg ~ 12000kg fresh grass per hectare; Level 3 Grassland: 6000kg ~ 9000kg fresh grass per hectare; Level 4 Grassland: 4500kg ~ 6000kg fresh grass per hectare; Level 5 Grassland: 30001kg ~ 4500kg fresh grass per hectare; Grade 6 Grassland: 1500kg ~ 3000kg fresh grass per hectare; Grade 7 Grassland: 750KG ~ 1500kg fresh grass per hectare; Grade 8 Grassland: fresh grass per hectare is less than 750KG. The data are compiled from the grassland station of Qinghai Province and the grassland resources statistics of Qinghai Province issued in 1988 and 2012. The data set contains two data tables, namely: statistical data of natural grassland grade area in Haidong area (2012) and statistical data of natural grassland grade in Haidong area (1988). The data table structure is similar. For example, the statistical data of natural grassland grade area in Haidong area (2012) has 9 fields: Field 1: Total Field 2: Level 1 Field 3: Level 2 Field 4: Level 3 Field 5: Level 4 Field 6: Level 5 Field 7:6 level Field 8: Level 7 Field 9: level 8
AGRICULTURAL AND RURAL Department of Qinghai Province
")
The data set records the statistical data of grassland type area and livestock carrying capacity in Haidong area of Qinghai Province in 1988 and 2012. The data are classified and counted according to the grassland group code, such as: I represents Alpine dry grassland, II represents mountain dry grassland, III represents Alpine desert, B represents medium grass group, J represents shrub group, etc, For specific grassland group type codes and their corresponding meanings, see "description of grassland group type codes in Qinghai Province. PDF" in the data set. The data are compiled from the grassland station of Qinghai Province and the grassland resources statistics of Qinghai Province issued in 1988 and 2012. The data set contains three data tables, which are: statistical data of grassland area and livestock carrying capacity of various types in Haidong area (1988), statistical data of grassland area and livestock carrying capacity in Haidong area (2012) and description of grassland group code in Qinghai Province. The data table structure is similar. For example, there are 8 fields in the statistical data (2012) of grassland type, area and livestock carrying capacity in Haidong area: Field 1: type code Field 2: grassland type name Field 3: grassland area Field 4: available area of grassland Field 5: average unit yield of fresh grass Field 6: average unit yield of edible fresh grass Field 7: stocking capacity Field 8: grassland type, etc
AGRICULTURAL AND RURAL Department of Qinghai Province
")
The data set records the statistical data of natural grassland grade area in Haibei Prefecture, Qinghai Province in 1988 and 2012. The data are classified and counted according to the grade code of natural grassland. The grassland is divided into five grades: excellent, good, medium, low and inferior with grassland type as the basic unit. The classification criteria of each grade are as follows: Grade I (excellent) Grassland: the weight of excellent forage accounts for more than 60%; Grade II (good grade) Grassland: the weight of grass above good grade accounts for more than 60%, and that of other types accounts for 40%; Grade III (medium) Grassland: the weight of forages above the medium category accounts for more than 60%, and that of other categories accounts for 40%; Grade IV (low) Grassland: the weight of grass above the low category accounts for more than 60%, and that of other categories accounts for 40%; Grade V (inferior) Grassland: the weight of inferior forage accounts for more than 40% The grassland level is divided into 8 levels according to the fresh grass yield. Standards at all levels are as follows: Level 1 Grassland: more than 12000k g of fresh grass per hectare of grassland; Level 2 Grassland: 9000kg ~ 12000kg fresh grass per hectare; Level 3 Grassland: 6000kg ~ 9000kg fresh grass per hectare; Level 4 Grassland: 4500kg ~ 6000kg fresh grass per hectare; Level 5 Grassland: 30001kg ~ 4500kg fresh grass per hectare; Grade 6 Grassland: 1500kg ~ 3000kg fresh grass per hectare; Grade 7 Grassland: 750KG ~ 1500kg fresh grass per hectare; Grade 8 Grassland: fresh grass per hectare is less than 750KG. The data are compiled from the grassland station of Qinghai Province and the grassland resources statistics of Qinghai Province issued in 1988 and 2012. The data set contains two data tables, namely: statistical data of natural grassland grade area in Haibei prefecture (2012) and statistical data of natural grassland grade in Haibei Tibetan Autonomous Prefecture (1988). The data table structure is similar. For example, the statistical data of natural grassland grade area in Haibei prefecture (2012) has 9 fields: Field 1: Total Field 2: Level 1 Field 3: Level 2 Field 4: Level 3 Field 5: Level 4 Field 6: Level 5 Field 7:6 level Field 8: Level 7 Field 9: level 8
AGRICULTURAL AND RURAL Department of Qinghai Province
")
The data set records the statistical data of grassland type area and livestock carrying capacity in Haibei Prefecture of Qinghai Province in 1988 and 2012. The data are classified and counted according to the grassland group code, such as: I represents Alpine dry grassland, II represents mountain dry grassland, III represents Alpine desert, B represents medium grass group, J represents shrub group, etc, For specific grassland group type codes and their corresponding meanings, see "description of grassland group type codes in Qinghai Province. PDF" in the data set. The data are compiled from the grassland station of Qinghai Province and the grassland resources statistics of Qinghai Province issued in 1988 and 2012. The data set contains three data tables, which are: statistical data of grassland area and livestock carrying capacity of various types in Haibei Tibetan Autonomous Prefecture (1988), statistical data of grassland area and livestock carrying capacity in Haibei prefecture (2012) and code description of grassland types in Qinghai Province. The data table structure is similar. For example, there are 8 fields in the statistical data (2012) of grassland type, area and livestock carrying capacity in Haibei Prefecture: Field 1: type code Field 2: grassland type name Field 3: grassland area Field 4: available area of grassland Field 5: average unit yield of fresh grass Field 6: average unit yield of edible fresh grass Field 7: stocking capacity Field 8: grassland type, etc
AGRICULTURAL AND RURAL Department of Qinghai Province
")
The data set records the statistical data of natural grassland grade area in Golog Prefecture, Qinghai Province in 1988 and 2012. The data are classified and counted according to the grade code of natural grassland. The grassland is divided into five grades: excellent, good, medium, low and poor with grassland type as the basic unit. The classification criteria of each grade are as follows: Grade I (excellent) Grassland: the weight of excellent forage accounts for more than 60%; Grade II (good grade) Grassland: the weight of grass above good grade accounts for more than 60%, and that of other types accounts for 40%; Grade III (medium) Grassland: the weight of forages above the medium category accounts for more than 60%, and that of other categories accounts for 40%; Grade IV (low) Grassland: the weight of grass above the low category accounts for more than 60%, and that of other categories accounts for 40%; Grade V (inferior) Grassland: the weight of inferior forage accounts for more than 40% The grassland level is divided into 8 levels according to the fresh grass yield. Standards at all levels are as follows: Level 1 Grassland: more than 12000k g of fresh grass per hectare of grassland; Level 2 Grassland: 9000kg ~ 12000kg fresh grass per hectare; Level 3 Grassland: 6000kg ~ 9000kg fresh grass per hectare; Level 4 Grassland: 4500kg ~ 6000kg fresh grass per hectare; Level 5 Grassland: 30001kg ~ 4500kg fresh grass per hectare; Grade 6 Grassland: 1500kg ~ 3000kg fresh grass per hectare; Grade 7 Grassland: 750KG ~ 1500kg fresh grass per hectare; Grade 8 Grassland: fresh grass per hectare is less than 750KG. The data are compiled from the grassland station of Qinghai Province and the grassland resources statistics of Qinghai Province issued in 1988 and 2012. The data set contains two data tables, namely: statistical data of natural grassland grade area in Golog prefecture (2012) and statistical data of natural grassland grade in Golog Tibetan Autonomous Prefecture (1988). The data table structure is similar. For example, there are 9 fields in the statistical data (2012) of natural grassland grade area in Luozhou: Field 1: Total Field 2: Level 1 Field 3: Level 2 Field 4: Level 3 Field 5: Level 4 Field 6: Level 5 Field 7:6 level Field 8: Level 7 Field 9: level 8
AGRICULTURAL AND RURAL Department of Qinghai Province
")
The data set records the statistical data of grassland type area and livestock carrying capacity in Golog Prefecture, Qinghai Province in 1988 and 2012. The data are classified and counted according to the grassland group code, such as: I represents Alpine dry grassland, II represents mountain dry grassland, III represents Alpine desert, B represents medium grass group, J represents shrub group, etc, For specific grassland group type codes and their corresponding meanings, see "description of grassland group type codes in Qinghai Province. PDF" in the data set. The data are compiled from the grassland station of Qinghai Province and the grassland resources statistics of Qinghai Province issued in 1988 and 2012. The data set contains three data tables, which are: statistical data of grassland area and livestock carrying capacity of Golog Tibetan Autonomous Prefecture (1988), statistical data of grassland area and livestock carrying capacity of Golog prefecture (2012) and code description of grassland group type in Qinghai Province. The data table structure is similar. For example, there are 8 fields in the statistical data (2012) of grassland type, area and livestock carrying capacity in Luozhou: Field 1: type code Field 2: grassland type name Field 3: grassland area Field 4: available area of grassland Field 5: average unit yield of fresh grass Field 6: average unit yield of edible fresh grass Field 7: stocking capacity Field 8: grassland type, etc
AGRICULTURAL AND RURAL Department of Qinghai Province
")
The data set records the statistical data of natural grassland grade area in Guinan County, Qinghai Province in 1988 and 2012. The data are classified and counted according to the grade code of natural grassland. The grassland is divided into five grades: excellent, good, medium, low and inferior based on the grassland type. The classification criteria of each grade are as follows: Grade I (excellent) Grassland: the weight of excellent forage accounts for more than 60%; Grade II (good grade) Grassland: the weight of grass above good grade accounts for more than 60%, and that of other types accounts for 40%; Grade III (medium) Grassland: the weight of forages above the medium category accounts for more than 60%, and that of other categories accounts for 40%; Grade IV (low) Grassland: the weight of grass above the low category accounts for more than 60%, and that of other categories accounts for 40%; Grade V (inferior) Grassland: the weight of inferior forage accounts for more than 40% The grassland level is divided into 8 levels according to the fresh grass yield. Standards at all levels are as follows: Level 1 Grassland: more than 12000k g of fresh grass per hectare of grassland; Level 2 Grassland: 9000kg ~ 12000kg fresh grass per hectare; Level 3 Grassland: 6000kg ~ 9000kg fresh grass per hectare; Level 4 Grassland: 4500kg ~ 6000kg fresh grass per hectare; Level 5 Grassland: 30001kg ~ 4500kg fresh grass per hectare; Grade 6 Grassland: 1500kg ~ 3000kg fresh grass per hectare; Grade 7 Grassland: 750KG ~ 1500kg fresh grass per hectare; Grade 8 Grassland: fresh grass per hectare is less than 750KG. The data are compiled from the grassland station of Qinghai Province and the grassland resources statistics of Qinghai Province issued in 1988 and 2012. The data set contains two data tables, namely, the statistical data of natural grassland grade area in Guinan county (2012) and the statistical data of natural grassland grade in Guinan county (1988). The data table structure is similar. For example, there are 9 fields in the statistical data of natural grassland grade area in Guinan county (2012): Field 1: Total Field 2: Level 1 Field 3: Level 2 Field 4: Level 3 Field 5: Level 4 Field 6: Level 5 Field 7:6 level Field 8: Level 7 Field 9: level 8
AGRICULTURAL AND RURAL Department of Qinghai Province
")
The data set records the statistical data of grassland type area and livestock carrying capacity in Guinan County, Qinghai Province in 1988 and 2012. The data are classified and counted according to the grassland group code, such as: I represents Alpine dry grassland, II represents mountain dry grassland, III represents Alpine desert, B represents medium grass group, J represents shrub group, etc, For specific grassland group type codes and their corresponding meanings, see "description of grassland group type codes in Qinghai Province. PDF" in the data set. The data are compiled from the grassland station of Qinghai Province and the grassland resources statistics of Qinghai Province issued in 1988 and 2012. The data set contains three data tables, which are: grassland type area and livestock carrying capacity statistics of Guinan county (1988), grassland type area and livestock carrying capacity statistics of Guinan county (2012) and grassland type code description of Qinghai Province. The data table structure is similar. For example, there are 8 fields in the statistical data (2012) of grassland type, area and livestock carrying capacity in Guinan County: Field 1: type code Field 2: grassland type name Field 3: grassland area Field 4: available area of grassland Field 5: average unit yield of fresh grass Field 6: average unit yield of edible fresh grass Field 7: stocking capacity Field 8: grassland type grade
AGRICULTURAL AND RURAL Department of Qinghai Province
")
The data set records the statistical data of natural grassland grade area in guide County, Qinghai Province in 1988 and 2012. The data are classified and counted according to the grade code of natural grassland. The grassland type is the basic unit and is divided into five grades: excellent, good, medium, low and poor. The classification criteria of each grade are as follows: Grade I (excellent) Grassland: the weight of excellent forage accounts for more than 60%; Grade II (good grade) Grassland: the weight of grass above good grade accounts for more than 60%, and that of other types accounts for 40%; Grade III (medium) Grassland: the weight of forages above the medium category accounts for more than 60%, and that of other categories accounts for 40%; Grade IV (low) Grassland: the weight of grass above the low category accounts for more than 60%, and that of other categories accounts for 40%; Grade V (inferior) Grassland: the weight of inferior forage accounts for more than 40% The grassland level is divided into 8 levels according to the fresh grass yield. Standards at all levels are as follows: Level 1 Grassland: more than 12000k g of fresh grass per hectare of grassland; Level 2 Grassland: 9000kg ~ 12000kg fresh grass per hectare; Level 3 Grassland: 6000kg ~ 9000kg fresh grass per hectare; Level 4 Grassland: 4500kg ~ 6000kg fresh grass per hectare; Level 5 Grassland: 30001kg ~ 4500kg fresh grass per hectare; Grade 6 Grassland: 1500kg ~ 3000kg fresh grass per hectare; Grade 7 Grassland: 750KG ~ 1500kg fresh grass per hectare; Grade 8 Grassland: fresh grass per hectare is less than 750KG. The data are compiled from the grassland station of Qinghai Province and the grassland resources statistics of Qinghai Province issued in 1988 and 2012. The data set contains two data tables, namely, the statistical data of natural grassland grade area in Guide county (2012) and the statistical data of natural grassland grade in Guide county (1988). The data table structure is similar. For example, there are 9 fields in the statistical data of natural grassland grade area in Guide county (2012): Field 1: Total Field 2: Level 1 Field 3: Level 2 Field 4: Level 3 Field 5: Level 4 Field 6: Level 5 Field 7:6 level Field 8: Level 7 Field 9: level 8
AGRICULTURAL AND RURAL Department of Qinghai Province
")
The data set records the statistical data of grassland type area and livestock carrying capacity in guide County, Qinghai Province in 1988 and 2012. The data are classified and counted according to the grassland group code, such as: I represents Alpine dry grassland, II represents mountain dry grassland, III represents Alpine desert, B represents medium grass group, J represents shrub group, etc, For specific grassland group type codes and their corresponding meanings, see "description of grassland group type codes in Qinghai Province. PDF" in the data set. The data are compiled from the grassland station of Qinghai Province and the grassland resources statistics of Qinghai Province issued in 1988 and 2012. The data set contains three data tables, which are: grassland type area and livestock carrying capacity statistics of Guide county (1988), grassland type area and livestock carrying capacity statistics of Guide county (2012) and grassland type code description of Qinghai Province. The data table structure is similar. For example, there are 8 fields in the statistical data (2012) of grassland type, area and livestock carrying capacity in Guide county: Field 1: type code Field 2: grassland type name Field 3: grassland area Field 4: available area of grassland Field 5: average unit yield of fresh grass Field 6: average unit yield of edible fresh grass Field 7: stocking capacity Field 8: grassland type grade
AGRICULTURAL AND RURAL Department of Qinghai Province
")
The data set records the statistical data of natural grassland grade area in Gonghe County, Qinghai Province in 1988 and 2012. The data are classified and counted according to the grade code of natural grassland. The grassland is divided into five grades: excellent, good, medium, low and poor with grassland type as the basic unit. The classification criteria of each grade are as follows: Grade I (excellent) Grassland: the weight of excellent forage accounts for more than 60%; Grade II (good grade) Grassland: the weight of grass above good grade accounts for more than 60%, and that of other types accounts for 40%; Grade III (medium) Grassland: the weight of forages above the medium category accounts for more than 60%, and that of other categories accounts for 40%; Grade IV (low) Grassland: the weight of grass above the low category accounts for more than 60%, and that of other categories accounts for 40%; Grade V (inferior) Grassland: the weight of inferior forage accounts for more than 40% The grassland level is divided into 8 levels according to the fresh grass yield. Standards at all levels are as follows: Level 1 Grassland: more than 12000k g of fresh grass per hectare of grassland; Level 2 Grassland: 9000kg ~ 12000kg fresh grass per hectare; Level 3 Grassland: 6000kg ~ 9000kg fresh grass per hectare; Level 4 Grassland: 4500kg ~ 6000kg fresh grass per hectare; Level 5 Grassland: 30001kg ~ 4500kg fresh grass per hectare; Grade 6 Grassland: 1500kg ~ 3000kg fresh grass per hectare; Grade 7 Grassland: 750KG ~ 1500kg fresh grass per hectare; Grade 8 Grassland: fresh grass per hectare is less than 750KG. The data are compiled from the grassland station of Qinghai Province and the grassland resources statistics of Qinghai Province issued in 1988 and 2012. The data set contains two data tables: statistical data of natural grassland grade area in Gonghe County (2012) and statistical data of natural grassland grade in Gonghe County (1988). The data table structure is similar. For example, the statistical data of natural grassland grade area in Gonghe County (2012) has 9 fields: Field 1: Total Field 2: Level 1 Field 3: Level 2 Field 4: Level 3 Field 5: Level 4 Field 6: Level 5 Field 7:6 level Field 8: Level 7 Field 9: level 8
AGRICULTURAL AND RURAL Department of Qinghai Province
")
The data set records the statistical data of grassland type area and livestock carrying capacity in Gonghe County, Qinghai Province in 1988 and 2012. The data are classified and counted according to the grassland group code, such as: I represents Alpine dry grassland, II represents mountain dry grassland, III represents Alpine desert, B represents medium grass group, J represents shrub group, etc, For specific grassland group type codes and their corresponding meanings, see "description of grassland group type codes in Qinghai Province. PDF" in the data set. The data are compiled from the grassland station of Qinghai Province and the grassland resources statistics of Qinghai Province issued in 1988 and 2012. The data set contains three data tables, namely: grassland type area and livestock carrying capacity statistics of Gonghe County (1988), grassland type area and livestock carrying capacity statistics of Gonghe County (2012) and grassland group code description of Qinghai Province. The data table structure is similar. For example, there are 8 fields in the statistical data (2012) of grassland type, area and livestock carrying capacity in Gonghe County: Field 1: type code Field 2: grassland type name Field 3: grassland area Field 4: available area of grassland Field 5: average unit yield of fresh grass Field 6: average unit yield of edible fresh grass Field 7: stocking capacity Field 8: grassland type grade
AGRICULTURAL AND RURAL Department of Qinghai Province
")
The data set records the statistical data on the area and livestock carrying capacity of various types of grassland in Qinghai Province in 1988 and 2012. The data are classified and counted according to the grassland group code, such as: I represents Alpine dry grassland, II represents mountain dry grassland, III represents Alpine desert, B represents medium grass group, J represents shrub group, etc, For specific grassland group type codes and their corresponding meanings, see "description of grassland group type codes in Qinghai Province. PDF" in the data set. The data are compiled from the grassland station of Qinghai Province and the grassland resources statistics of Qinghai Province issued in 1988 and 2012. The data set contains three data tables, namely: statistical data of grassland area and livestock carrying capacity of various types in Qinghai Province (1988), statistical data of grassland area and livestock carrying capacity in Qinghai Province (2012) and description of grassland group code in Qinghai Province. The data table structure is similar. For example, statistics of grassland type, area and livestock carrying capacity in Qinghai Province (2012) The table has 8 fields: Field 1: type code Field 2: grassland type name Field 3: grassland area Field 4: available area of grassland Field 5: average unit yield of fresh grass Field 6: average unit yield of edible fresh grass Field 7: stocking capacity Field 8: grassland type grade
AGRICULTURAL AND RURAL Department of Qinghai Province
")
The data set records the statistical data of natural grassland grade area in Golmud City, Qinghai Province in 1988 and 2012. The data are classified and counted according to the grade code of natural grassland. The grassland is divided into five grades: excellent, good, medium, low and inferior with grassland type as the basic unit. The classification criteria of each grade are as follows: Grade I (excellent) Grassland: the weight of excellent forage accounts for more than 60%; Grade II (good grade) Grassland: the weight of grass above good grade accounts for more than 60%, and that of other types accounts for 40%; Grade III (medium) Grassland: the weight of forages above the medium category accounts for more than 60%, and that of other categories accounts for 40%; Grade IV (low) Grassland: the weight of grass above the low category accounts for more than 60%, and that of other categories accounts for 40%; Grade V (inferior) Grassland: the weight of inferior forage accounts for more than 40% The grassland level is divided into 8 levels according to the fresh grass yield. Standards at all levels are as follows: Level 1 Grassland: more than 12000k g of fresh grass per hectare of grassland; Level 2 Grassland: 9000kg ~ 12000kg fresh grass per hectare; Level 3 Grassland: 6000kg ~ 9000kg fresh grass per hectare; Level 4 Grassland: 4500kg ~ 6000kg fresh grass per hectare; Level 5 Grassland: 30001kg ~ 4500kg fresh grass per hectare; Grade 6 Grassland: 1500kg ~ 3000kg fresh grass per hectare; Grade 7 Grassland: 750KG ~ 1500kg fresh grass per hectare; Grade 8 Grassland: fresh grass per hectare is less than 750KG. The data are compiled from the grassland station of Qinghai Province and the grassland resources statistics of Qinghai Province issued in 1988 and 2012. The data set contains two data tables, namely: Statistics of natural grassland grade area in Golmud City (2012) and statistics of natural grassland grade in Golmud City (1988). The data table structure is similar. For example, there are 9 fields in the statistical data of natural grassland grade area in Golmud City (2012): Field 1: Total Field 2: Level 1 Field 3: Level 2 Field 4: Level 3 Field 5: Level 4 Field 6: Level 5 Field 7:6 level Field 8: Level 7 Field 9: level 8
AGRICULTURAL AND RURAL Department of Qinghai Province
")
The data set records the statistical data of grassland type area and livestock carrying capacity in Golmud City, Qinghai Province in 1988 and 2012. The data are classified and counted according to the grassland group code, such as: I represents Alpine dry grassland, II represents mountain dry grassland, III represents Alpine desert, B represents medium grass group, J represents shrub group, etc, For specific grassland group type codes and their corresponding meanings, see "description of grassland group type codes in Qinghai Province. PDF" in the data set. The data are compiled from the grassland station of Qinghai Province and the grassland resources statistics of Qinghai Province issued in 1988 and 2012. The data set contains three data tables, which are: statistical data of grassland type area and livestock carrying capacity in Golmud City (1988), statistical data of grassland type area and livestock carrying capacity in Golmud City (2012) and code description of grassland type in Qinghai Province. The data table structure is similar. For example, there are 8 fields in the statistical data (2012) of grassland type, area and livestock carrying capacity in Golmud City: Field 1: type code Field 2: grassland type name Field 3: grassland area Field 4: available area of grassland Field 5: average unit yield of fresh grass Field 6: average unit yield of edible fresh grass Field 7: stocking capacity Field 8: grassland type grade
AGRICULTURAL AND RURAL Department of Qinghai Province
")
The data set records the statistical data of natural grassland grade area in Gangcha County, Qinghai Province in 1988 and 2012. The data are classified and counted according to the grade code of natural grassland. The grassland is divided into five grades: excellent, good, medium, low and inferior based on the grassland type. The classification criteria of each grade are as follows: Grade I (excellent) Grassland: the weight of excellent forage accounts for more than 60%; Grade II (good grade) Grassland: the weight of grass above good grade accounts for more than 60%, and that of other types accounts for 40%; Grade III (medium) Grassland: the weight of forages above the medium category accounts for more than 60%, and that of other categories accounts for 40%; Grade IV (low) Grassland: the weight of grass above the low category accounts for more than 60%, and that of other categories accounts for 40%; Grade V (inferior) Grassland: the weight of inferior forage accounts for more than 40% The grassland level is divided into 8 levels according to the fresh grass yield. Standards at all levels are as follows: Level 1 Grassland: more than 12000k g of fresh grass per hectare of grassland; Level 2 Grassland: 9000kg ~ 12000kg fresh grass per hectare; Level 3 Grassland: 6000kg ~ 9000kg fresh grass per hectare; Level 4 Grassland: 4500kg ~ 6000kg fresh grass per hectare; Level 5 Grassland: 30001kg ~ 4500kg fresh grass per hectare; Grade 6 Grassland: 1500kg ~ 3000kg fresh grass per hectare; Grade 7 Grassland: 750KG ~ 1500kg fresh grass per hectare; Grade 8 Grassland: fresh grass per hectare is less than 750KG. The data are compiled from the grassland station of Qinghai Province and the grassland resources statistics of Qinghai Province issued in 1988 and 2012. The data set contains two data tables, namely: statistical data of natural grassland grade area in Gangca county (2012) and statistical data of natural grassland grade in Gangca county (1988). The data table structure is similar. For example, there are 9 fields in the statistical data of natural grassland grade area in Gangcha county (2012): Field 1: Total Field 2: Level 1 Field 3: Level 2 Field 4: Level 3 Field 5: Level 4 Field 6: Level 5 Field 7:6 level Field 8: Level 7 Field 9: level 8
AGRICULTURAL AND RURAL Department of Qinghai Province
")
The data set records the statistical data of grassland type area and livestock carrying capacity in Gangcha County, Qinghai Province in 1988 and 2012. The data are classified and counted according to the grassland group code, such as: I represents Alpine dry grassland, II represents mountain dry grassland, III represents Alpine desert, B represents medium grass group, J represents shrub group, etc, For specific grassland group type codes and their corresponding meanings, see "description of grassland group type codes in Qinghai Province. PDF" in the data set. The data are compiled from the grassland station of Qinghai Province and the grassland resources statistics of Qinghai Province issued in 1988 and 2012. The data set contains three data tables, namely: grassland type area and livestock carrying capacity statistics of Gangca county (1988), grassland type area and livestock carrying capacity statistics of Gangca county (2012) and grassland group code description of Qinghai Province. The data table structure is similar. For example, there are 8 fields in the statistical data (2012) of grassland type, area and livestock carrying capacity in Gangca County: Field 1: type code Field 2: grassland type name Field 3: grassland area Field 4: available area of grassland Field 5: average unit yield of fresh grass Field 6: average unit yield of edible fresh grass Field 7: stocking capacity Field 8: grassland type grade
AGRICULTURAL AND RURAL Department of Qinghai Province
")
The data set records the statistical data of natural grassland grade area in Gande County, Qinghai Province in 1988 and 2012. The data are classified and counted according to the grade code of natural grassland. The grassland is divided into five grades: excellent, good, medium, low and inferior based on the grassland type. The classification criteria of each grade are as follows: Grade I (excellent) Grassland: the weight of excellent forage accounts for more than 60%; Grade II (good grade) Grassland: the weight of grass above good grade accounts for more than 60%, and that of other types accounts for 40%; Grade III (medium) Grassland: the weight of forages above the medium category accounts for more than 60%, and that of other categories accounts for 40%; Grade IV (low) Grassland: the weight of grass above the low category accounts for more than 60%, and that of other categories accounts for 40%; Grade V (inferior) Grassland: the weight of inferior forage accounts for more than 40% The grassland level is divided into 8 levels according to the fresh grass yield. Standards at all levels are as follows: Level 1 Grassland: more than 12000k g of fresh grass per hectare of grassland; Level 2 Grassland: 9000kg ~ 12000kg fresh grass per hectare; Level 3 Grassland: 6000kg ~ 9000kg fresh grass per hectare; Level 4 Grassland: 4500kg ~ 6000kg fresh grass per hectare; Level 5 Grassland: 30001kg ~ 4500kg fresh grass per hectare; Grade 6 Grassland: 1500kg ~ 3000kg fresh grass per hectare; Grade 7 Grassland: 750KG ~ 1500kg fresh grass per hectare; Grade 8 Grassland: fresh grass per hectare is less than 750KG. The data are compiled from the grassland station of Qinghai Province and the grassland resources statistics of Qinghai Province issued in 1988 and 2012. The data set contains two data tables, namely: the statistical data of natural grassland grade area in Gande county (2012) and the statistical data of natural grassland grade in Gande county (1988). The data table structure is similar. For example, there are 9 fields in the statistical data of natural grassland grade area in Gande county (2012): Field 1: Total Field 2: Level 1 Field 3: Level 2 Field 4: Level 3 Field 5: Level 4 Field 6: Level 5 Field 7:6 level Field 8: Level 7 Field 9: level 8
AGRICULTURAL AND RURAL Department of Qinghai Province
")
The data set records the statistical data of grassland type area and livestock carrying capacity in Gande County, Qinghai Province in 1988 and 2012. The data are classified and counted according to the grassland group code, such as: I represents Alpine dry grassland, II represents mountain dry grassland, III represents Alpine desert, B represents medium grass group, J represents shrub group, etc, For specific grassland group type codes and their corresponding meanings, see "description of grassland group type codes in Qinghai Province. PDF" in the data set. The data are compiled from the grassland station of Qinghai Province and the grassland resources statistics of Qinghai Province issued in 1988 and 2012. The data set contains three data tables, namely: statistical data of grassland type area and livestock carrying capacity in Gande county (1988), statistical data of grassland type area and livestock carrying capacity in Gande county (2012) and code description of grassland type in Qinghai Province. The data table structure is similar. For example, there are 8 fields in the statistical data (2012) of grassland type, area and livestock carrying capacity in Gande County: Field 1: type code Field 2: grassland type name Field 3: grassland area Field 4: available area of grassland Field 5: average unit yield of fresh grass Field 6: average unit yield of edible fresh grass Field 7: stocking capacity Field 8: grassland type grade
AGRICULTURAL AND RURAL Department of Qinghai Province
")
The data set records the statistical data of natural grassland grade area in Dulan County, Qinghai Province in 1988 and 2012. The data are classified and counted according to the grade code of natural grassland. The grassland is divided into five grades: excellent, good, medium, low and inferior based on the grassland type. The classification criteria of each grade are as follows: Grade I (excellent) Grassland: the weight of excellent forage accounts for more than 60%; Grade II (good grade) Grassland: the weight of grass above good grade accounts for more than 60%, and that of other types accounts for 40%; Grade III (medium) Grassland: the weight of forages above the medium category accounts for more than 60%, and that of other categories accounts for 40%; Grade IV (low) Grassland: the weight of grass above the low category accounts for more than 60%, and that of other categories accounts for 40%; Grade V (inferior) Grassland: the weight of inferior forage accounts for more than 40% The grassland level is divided into 8 levels according to the fresh grass yield. Standards at all levels are as follows: Level 1 Grassland: more than 12000k g of fresh grass per hectare of grassland; Level 2 Grassland: 9000kg ~ 12000kg fresh grass per hectare; Level 3 Grassland: 6000kg ~ 9000kg fresh grass per hectare; Level 4 Grassland: 4500kg ~ 6000kg fresh grass per hectare; Level 5 Grassland: 30001kg ~ 4500kg fresh grass per hectare; Grade 6 Grassland: 1500kg ~ 3000kg fresh grass per hectare; Grade 7 Grassland: 750KG ~ 1500kg fresh grass per hectare; Grade 8 Grassland: fresh grass per hectare is less than 750KG. The data are compiled from the grassland station of Qinghai Province and the grassland resources statistics of Qinghai Province issued in 1988 and 2012. The data set contains two data tables, namely: statistical data of natural grassland grade area in Dulan county (2012) and statistical data of natural grassland grade in Dulan county (1988). The data table structure is similar. For example, there are 9 fields in the statistical data of natural grassland grade area in Dulan county (2012): Field 1: Total Field 2: Level 1 Field 3: Level 2 Field 4: Level 3 Field 5: Level 4 Field 6: Level 5 Field 7:6 level Field 8: Level 7 Field 9: level 8
AGRICULTURAL AND RURAL Department of Qinghai Province
")
The data set records the statistical data of grassland type area and livestock carrying capacity in Dulan County, Qinghai Province in 1988 and 2012. The data are classified and counted according to the grassland group code, such as: I represents Alpine dry grassland, II represents mountain dry grassland, III represents Alpine desert, B represents medium grass group, J represents shrub group, etc, For specific grassland group type codes and their corresponding meanings, see "description of grassland group type codes in Qinghai Province. PDF" in the data set. The data are compiled from the grassland station of Qinghai Province and the grassland resources statistics of Qinghai Province issued in 1988 and 2012. The data set contains three data tables, which are: grassland type area and livestock carrying capacity statistics of Dulan county (1988), grassland type area and livestock carrying capacity statistics of Dulan county (2012) and code description of grassland type in Qinghai Province. The data table structure is similar. For example, there are 8 fields in the statistical data (2012) of grassland type, area and livestock carrying capacity in Dulan County: Field 1: type code Field 2: grassland type name Field 3: grassland area Field 4: available area of grassland Field 5: average unit yield of fresh grass Field 6: average unit yield of edible fresh grass Field 7: stocking capacity Field 8: grassland type grade
AGRICULTURAL AND RURAL Department of Qinghai Province
")
The data set records the statistical data of natural grassland grade area in Datong County, Qinghai Province in 1988 and 2012. The data are classified and counted according to the grade code of natural grassland. The grassland is divided into five grades: excellent, good, medium, low and poor with grassland type as the basic unit. The classification criteria of each grade are as follows: Grade I (excellent) Grassland: the weight of excellent forage accounts for more than 60%; Grade II (good grade) Grassland: the weight of grass above good grade accounts for more than 60%, and that of other types accounts for 40%; Grade III (medium) Grassland: the weight of forages above the medium category accounts for more than 60%, and that of other categories accounts for 40%; Grade IV (low) Grassland: the weight of grass above the low category accounts for more than 60%, and that of other categories accounts for 40%; Grade V (inferior) Grassland: the weight of inferior forage accounts for more than 40% The grassland level is divided into 8 levels according to the fresh grass yield. Standards at all levels are as follows: Level 1 Grassland: more than 12000k g of fresh grass per hectare of grassland; Level 2 Grassland: 9000kg ~ 12000kg fresh grass per hectare; Level 3 Grassland: 6000kg ~ 9000kg fresh grass per hectare; Level 4 Grassland: 4500kg ~ 6000kg fresh grass per hectare; Level 5 Grassland: 30001kg ~ 4500kg fresh grass per hectare; Grade 6 Grassland: 1500kg ~ 3000kg fresh grass per hectare; Grade 7 Grassland: 750KG ~ 1500kg fresh grass per hectare; Grade 8 Grassland: fresh grass per hectare is less than 750KG. The data are compiled from the grassland station of Qinghai Province and the grassland resources statistics of Qinghai Province issued in 1988 and 2012. The data set contains two data tables: statistical data of natural grassland grade area in Datong County (2012) and statistical data of natural grassland grade in Datong County (1988). The data table structure is similar. For example, the statistical data of natural grassland grade area in Datong County (2012) has 8 fields: Field 1: Total Field 2: Level 1 Field 3: Level 2 Field 4: Level 3 Field 5: Level 4 Field 6: Level 5 Field 7:6 level Field 8: Level 7
AGRICULTURAL AND RURAL Department of Qinghai Province
")
The data set records the statistical data of grassland type area and livestock carrying capacity in Datong County, Qinghai Province in 1988 and 2012. The data are classified and counted according to the grassland group code, such as: I represents Alpine dry grassland, II represents mountain dry grassland, III represents Alpine desert, B represents medium grass group, J represents shrub group, etc, For specific grassland group type codes and their corresponding meanings, see "description of grassland group type codes in Qinghai Province. PDF" in the data set. The data are compiled from the grassland station of Qinghai Province and the grassland resources statistics of Qinghai Province issued in 1988 and 2012. The data set contains three data tables, which are: statistical data of grassland type area and livestock carrying capacity in Datong County (1988), statistical data of grassland type area and livestock carrying capacity in Datong County (2012) and code description of grassland type in Qinghai Province. The data table structure is similar. For example, there are 8 fields in the statistical data (2012) of grassland type area and livestock carrying capacity in Datong County: Field 1: type code Field 2: grassland type name Field 3: grassland area Field 4: available area of grassland Field 5: average unit yield of fresh grass Field 6: average unit yield of edible fresh grass Field 7: stocking capacity Field 8: grassland type grade
AGRICULTURAL AND RURAL Department of Qinghai Province
")
The data set records the statistical data of natural grassland grade area of Dachaidan Administrative Committee of Qinghai Province in 1988 and 2012. The data are classified and counted according to the grade code of natural grassland. The grassland type is the basic unit and is divided into five grades: excellent, good, medium, low and poor. The classification criteria of each grade are as follows: Grade I (excellent) Grassland: the weight of excellent forage accounts for more than 60%; Grade II (good grade) Grassland: the weight of grass above good grade accounts for more than 60%, and that of other types accounts for 40%; Grade III (medium) Grassland: the weight of forages above the medium category accounts for more than 60%, and that of other categories accounts for 40%; Grade IV (low) Grassland: the weight of grass above the low category accounts for more than 60%, and that of other categories accounts for 40%; Grade V (inferior) Grassland: the weight of inferior forage accounts for more than 40% The grassland level is divided into 8 levels according to the fresh grass yield. Standards at all levels are as follows: Level 1 Grassland: more than 12000k g of fresh grass per hectare of grassland; Level 2 Grassland: 9000kg ~ 12000kg fresh grass per hectare; Level 3 Grassland: 6000kg ~ 9000kg fresh grass per hectare; Level 4 Grassland: 4500kg ~ 6000kg fresh grass per hectare; Level 5 Grassland: 30001kg ~ 4500kg fresh grass per hectare; Grade 6 Grassland: 1500kg ~ 3000kg fresh grass per hectare; Grade 7 Grassland: 750KG ~ 1500kg fresh grass per hectare; Grade 8 Grassland: fresh grass per hectare is less than 750KG. The data are compiled from the grassland station of Qinghai Province and the grassland resources statistics of Qinghai Province issued in 1988 and 2012. The data set contains two data tables, namely: the statistical data of natural grassland grade area of Dachaidan Administrative Committee (2012) and the statistical data of natural grassland grade of Dachaidan town (1988). The data table structure is similar. For example, there are 9 fields in the statistical data (2012) of natural grassland grade area of Dachaidan Administrative Committee: Field 1: Total Field 2: Level 1 Field 3: Level 2 Field 4: Level 3 Field 5: Level 4 Field 6: Level 5 Field 7:6 level Field 8: Level 7 Field 9: level 8
AGRICULTURAL AND RURAL Department of Qinghai Province
")
The data set records the statistical data of grassland type area and livestock carrying capacity of Dachaidan Administrative Committee of Qinghai Province in 1988 and 2012. The data are classified and counted according to the grassland group code, such as: I represents Alpine dry grassland, II represents mountain dry grassland, III represents Alpine desert, grass group in generation B, J represents shrub group, etc, For specific grassland group type codes and their corresponding meanings, see "description of grassland group type codes in Qinghai Province. PDF" in the data set. The data are compiled from the grassland station of Qinghai Province and the grassland resources statistics of Qinghai Province issued in 1988 and 2012. The data set contains three data tables, namely: statistical data of grassland type area and livestock carrying capacity in Dachaidan town (1988), statistical data of grassland type area and livestock carrying capacity of Dachaidan Administrative Committee (2012) and code description of grassland type in Qinghai Province. The data table structure is similar. For example, there are 8 fields in the statistical data (2012) of grassland type, area and livestock carrying capacity of Dachaidan Administrative Committee: Field 1: type code Field 2: grassland type name Field 3: grassland area Field 4: available area of grassland Field 5: average unit yield of fresh grass Field 6: average unit yield of edible fresh grass Field 7: stocking capacity Field 8: grassland type grade
AGRICULTURAL AND RURAL Department of Qinghai Province
")
The data set records the statistical data of natural grassland grade area in dari County, Qinghai Province in 1988 and 2012. The data are classified and counted according to the grade code of natural grassland. The grassland is divided into five grades: excellent, good, medium, low and inferior based on the grassland type. The classification criteria of each grade are as follows: Grade I (excellent) Grassland: the weight of excellent forage accounts for more than 60%; Grade II (good grade) Grassland: the weight of grass above good grade accounts for more than 60%, and that of other types accounts for 40%; Grade III (medium) Grassland: the weight of forages above the medium category accounts for more than 60%, and that of other categories accounts for 40%; Grade IV (low) Grassland: the weight of grass above the low category accounts for more than 60%, and that of other categories accounts for 40%; Grade V (inferior) Grassland: the weight of inferior forage accounts for more than 40% The grassland level is divided into 8 levels according to the fresh grass yield. Standards at all levels are as follows: Level 1 Grassland: more than 12000k g of fresh grass per hectare of grassland; Level 2 Grassland: 9000kg ~ 12000kg fresh grass per hectare; Level 3 Grassland: 6000kg ~ 9000kg fresh grass per hectare; Level 4 Grassland: 4500kg ~ 6000kg fresh grass per hectare; Level 5 Grassland: 30001kg ~ 4500kg fresh grass per hectare; Grade 6 Grassland: 1500kg ~ 3000kg fresh grass per hectare; Grade 7 Grassland: 750KG ~ 1500kg fresh grass per hectare; Grade 8 Grassland: fresh grass per hectare is less than 750KG. The data are compiled from the grassland station of Qinghai Province and the grassland resources statistics of Qinghai Province issued in 1988 and 2012. The data set contains two data tables, namely: the statistical data of natural grassland grade area in dari county (2012) and the statistical data of natural grassland grade in dari county (1988). The data table structure is similar. For example, there are 9 fields in the statistical data of natural grassland grade area in dari county (2012): Field 1: Total Field 2: Level 1 Field 3: Level 2 Field 4: Level 3 Field 5: Level 4 Field 6: Level 5 Field 7:6 level Field 8: Level 7 Field 9: level 8
AGRICULTURAL AND RURAL Department of Qinghai Province
")
The data set records the statistical data of grassland type area and livestock carrying capacity in dari County, Qinghai Province in 1988 and 2012. The data are classified and counted according to the grassland group code, such as: I represents Alpine dry grassland, II represents mountain dry grassland, III represents Alpine desert, B represents medium grass group, J represents shrub group, etc, For specific grassland group type codes and their corresponding meanings, see "description of grassland group type codes in Qinghai Province. PDF" in the data set. The data are compiled from the grassland station of Qinghai Province and the grassland resources statistics of Qinghai Province issued in 1988 and 2012. The data set contains three data tables, namely: statistical data of grassland type area and livestock carrying capacity in dari county (1988), statistical data of grassland type area and livestock carrying capacity in dari county (2012) and code description of grassland type in Qinghai Province. The data table structure is similar. For example, there are 8 fields in the statistical data (2012) of grassland type, area and livestock carrying capacity in dari County: Field 1: type code Field 2: grassland type name Field 3: grassland area Field 4: available area of grassland Field 5: average unit yield of fresh grass Field 6: average unit yield of edible fresh grass Field 7: stocking capacity Field 8: grassland type grade
AGRICULTURAL AND RURAL Department of Qinghai Province
")
The data set records the statistical data of natural grassland grade area in Chengduo County, Qinghai Province in 1988 and 2012. The data are classified and counted according to the grade code of natural grassland. The grassland is divided into five grades: excellent, good, medium, low and poor with grassland type as the basic unit. The classification criteria of each grade are as follows: Grade I (excellent) Grassland: the weight of excellent forage accounts for more than 60%; Grade II (good grade) Grassland: the weight of grass above good grade accounts for more than 60%, and that of other types accounts for 40%; Grade III (medium) Grassland: the weight of forages above the medium category accounts for more than 60%, and that of other categories accounts for 40%; Grade IV (low) Grassland: the weight of grass above the low category accounts for more than 60%, and that of other categories accounts for 40%; Grade V (inferior) Grassland: the weight of inferior forage accounts for more than 40% The grassland level is divided into 8 levels according to the fresh grass yield. Standards at all levels are as follows: Level 1 Grassland: more than 12000k g of fresh grass per hectare of grassland; Level 2 Grassland: 9000kg ~ 12000kg fresh grass per hectare; Level 3 Grassland: 6000kg ~ 9000kg fresh grass per hectare; Level 4 Grassland: 4500kg ~ 6000kg fresh grass per hectare; Level 5 Grassland: 30001kg ~ 4500kg fresh grass per hectare; Grade 6 Grassland: 1500kg ~ 3000kg fresh grass per hectare; Grade 7 Grassland: 750KG ~ 1500kg fresh grass per hectare; Grade 8 Grassland: fresh grass per hectare is less than 750KG. The data are compiled from the grassland station of Qinghai Province and the grassland resources statistics of Qinghai Province issued in 1988 and 2012. The data set contains two data tables, namely: statistical data of natural grassland grade area in Chengduo county (2012) and statistical data of natural grassland grade in Chengduo county (1988). The data table structure is similar. For example, the statistical data of natural grassland grade area in Chengduo county (2012) has 9 fields: Field 1: Total Field 2: Level 1 Field 3: Level 2 Field 4: Level 3 Field 5: Level 4 Field 6: Level 5 Field 7:6 level Field 8: Level 7 Field 9: level 8
AGRICULTURAL AND RURAL Department of Qinghai Province
")
The data set records the statistical data of grassland type area and livestock carrying capacity in Chengduo County, Qinghai Province in 1988 and 2012. The data are classified and counted according to the grassland group code, such as: I represents Alpine dry grassland, II represents mountain dry grassland, III represents Alpine desert, B represents medium grass group, J represents shrub group, etc, For specific grassland group type codes and their corresponding meanings, see "description of grassland group type codes in Qinghai Province. PDF" in the data set. The data are compiled from the grassland station of Qinghai Province and the grassland resources statistics of Qinghai Province issued in 1988 and 2012. The data set contains three data tables, namely: statistical data of grassland type area and livestock carrying capacity in Chengduo county (1988), statistical data of grassland type area and livestock carrying capacity in Chengduo county (2012) and code description of grassland type in Qinghai Province. The data table structure is similar. For example, there are 8 fields in the statistical data (2012) of grassland type area and livestock carrying capacity in Chengduo County: Field 1: type code Field 2: grassland type name Field 3: grassland area Field 4: available area of grassland Field 5: average unit yield of fresh grass Field 6: average unit yield of edible fresh grass Field 7: stocking capacity Field 8: grassland type grade
AGRICULTURAL AND RURAL Department of Qinghai Province
")
The data set records the statistical data of natural grassland grade area in Bama County, Qinghai Province in 1988 and 2012. The data are classified and counted according to the grade code of natural grassland. The grassland is divided into five grades: excellent, good, medium, low and poor based on the grassland type. The classification criteria of each grade are as follows: Grade I (excellent) Grassland: the weight of excellent forage accounts for more than 60%; Grade II (good grade) Grassland: the weight of grass above good grade accounts for more than 60%, and that of other types accounts for 40%; Grade III (medium) Grassland: the weight of forages above the medium category accounts for more than 60%, and that of other categories accounts for 40%; Grade IV (low) Grassland: the weight of grass above the low category accounts for more than 60%, and that of other categories accounts for 40%; Grade V (inferior) Grassland: the weight of inferior forage accounts for more than 40% The grassland level is divided into 8 levels according to the fresh grass yield. Standards at all levels are as follows: Level 1 Grassland: more than 12000k g of fresh grass per hectare of grassland; Level 2 Grassland: 9000kg ~ 12000kg fresh grass per hectare; Level 3 Grassland: 6000kg ~ 9000kg fresh grass per hectare; Level 4 Grassland: 4500kg ~ 6000kg fresh grass per hectare; Level 5 Grassland: 30001kg ~ 4500kg fresh grass per hectare; Grade 6 Grassland: 1500kg ~ 3000kg fresh grass per hectare; Grade 7 Grassland: 750KG ~ 1500kg fresh grass per hectare; Grade 8 Grassland: fresh grass per hectare is less than 750KG. The data are compiled from the grassland station of Qinghai Province and the grassland resources statistics of Qinghai Province issued in 1988 and 2012. The data set contains two data tables, namely: Statistics of natural grassland grade area in Bama County (2012) and statistics of natural grassland grade in Bama County (1988). The data table structure is similar. For example, there are 9 fields in the statistical data of natural grassland grade area in Bama County (2012): Field 1: Total Field 2: Level 1 Field 3: Level 2 Field 4: Level 3 Field 5: Level 4 Field 6: Level 5 Field 7:6 level Field 8: Level 7 Field 9: level 8
AGRICULTURAL AND RURAL Department of Qinghai Province
")
The data set records the statistical data of grassland type area and livestock carrying capacity in Bama County, Qinghai Province in 1988 and 2012. The data are classified and counted according to the grassland group code, such as: I represents Alpine dry grassland, II represents mountain dry grassland, III represents Alpine desert, B represents medium grass group, J represents shrub group, etc, For specific grassland group type codes and their corresponding meanings, see "description of grassland group type codes in Qinghai Province. PDF" in the data set. The data are compiled from the grassland station of Qinghai Province and the grassland resources statistics of Qinghai Province issued in 1988 and 2012. The data set contains three data tables, which are: grassland type area and livestock carrying capacity statistics of Bama County (2012), grassland type area and livestock carrying capacity statistics of Bama County (1988) and grassland type code description of Qinghai Province. The data table structure is similar. For example, there are 8 fields in the statistical data (2012) of grassland type, area and livestock carrying capacity in Bama County: Field 1: type code Field 2: grassland type name Field 3: grassland area Field 4: available area of grassland Field 5: average unit yield of fresh grass Field 6: average unit yield of edible fresh grass Field 7: stocking capacity Field 8: grassland type grade
AGRICULTURAL AND RURAL Department of Qinghai Province

The basic principle of ancient recipe analysis based on carbon and nitrogen stable isotope analysis method is you are what you eat, that is, the chemical composition of animal tissues and organs is closely related to their diet. Through the detection of isotope ratio of relevant elements, the food structure of ancient people and animals can be directly revealed Then it discusses the research means of people's livelihood and livestock domestication. The collagen of human and animal bones from shilinggang site in Nujiang, Yunnan Province in the southwest of Qinghai Tibet Plateau was analyzed by carbon and nitrogen stable isotopes.
DONG Guanghui , REN Lele

The alpine and anoxic environment of the Qinghai Tibet Plateau is a major challenge for human survival and life. When human beings boarded the Qinghai Tibet Plateau and adapted to the extreme environment of the plateau has always been a hot issue in the academic circles. At present, in the study of prehistoric culture of the Qinghai Tibet Plateau, except the northeast, most areas of the Qinghai Tibet Plateau have not established archaeological cultural sequences. Yajiang river basin is one of the areas with dense distribution of human activity relics, but there are few archaeological excavations and studies, and the activity history of the ancients in this area is not clear. Based on the systematic dating of cultural archaeological sites in Linzhi Area, Southeast Tibet, 33 carbon fourteenth age data were obtained.
YANG Xiaoyan, WANG Yanren
")
As the roof of the world, the water tower of Asia and the third pole of the world, the Qinghai Tibet Plateau is an important ecological security barrier for China and even Asia. With the rapid development of social economy, human activities have increased significantly, and the impact on the ecological environment is growing. In this paper, eight factors including cultivated land, construction land, National Road, provincial road, railway, expressway, GDP and population density were selected as the threat factors, and the attributes of the threat factors were determined based on the expert scoring method to evaluate the habitat quality of the Qinghai Tibet Plateau, so as to obtain six data sets of the habitat quality of the agricultural and pastoral areas of the Qinghai Tibet Plateau in 1990, 1995, 2000, 2005, 2010 and 2015. The production of habitat quality data sets will help to explore the habitat quality of the Qinghai Tibet Plateau and provide effective support for the government to formulate sustainable development policies of the Qinghai Tibet Plateau.
LIU Shiliang, LIU Yixuan, SUN Yongxiu, LI Mingqi
 (1978-2003)")
The data set records the sown area and yield (state-owned) of crops in Qinghai Province, and the data are divided by crop categories. The data are collected from the statistical yearbook of Qinghai Province issued by the Bureau of statistics of Qinghai Province. The data set consists of 9 data tables Total sown area of crops 1978-2001.xls Total sown area of crops 1978-2002.xls Total sown area of crops 1978-2003.xls Sown area and yield of crops (whole society) 1997-1998.xls Sown area and yield of crops (whole society) 1998-1999.xls Sown area and yield of crops (whole society) 1999-2000.xls Sown area and yield of crops (state owned) 1997-1998.xls Sown area and yield of crops (state owned) 1998-1999.xls The structure of the. XLS data table of crop sown area and yield (state-owned) from 1999 to 2000 is similar. For example, there are eight fields in the 1997-1998 data table of crop sown area and yield (state-owned) Field 1: Region Field 2: Area Field 3: Crops Field 4: Wheat Field 5: coarse cereals Field 6: potatoes Field 7: Crops Field 8: Oil
Qinghai Provincial Bureau of Statistics
")
The data set recorded the sown area and cropping structure of crops in Qinghai province from 1952 to 2020, divided by major years and regions such as Xining, Haidong, Haibei, Huangnan, Hainan, Guoluo, Yushu and Haixi. The data are collected from qinghai Statistical Yearbook released by Qinghai Provincial Bureau of Statistics. The dataset contains 39 data tables, which are: Main crops sown area and planting structure 2000-2003. XLS Main crop planting structure 2000-2001. XLS Main crop planting structure 2001-2002. XLS Total sown area of crops in main years 1978-2004. XLS Total sown area of crops in main years 1978-2008. XLS Total sown area of crops in main years 1978-2009. XLS Total sown area of crops in main years 1978-2010. XLS Total sown area of crops in main years 1978-2011. XLS Total sown area of crops in main years 1978-2013. XLS Total sown area of crops in main years 1978-2014. XLS Total sown area of crops in main years 1978-2015. XLS Total sown area of crops in main years 1978-2016. XLS Total sown area of crops in main years 1978-2017. XLS Total sown area of crops in main years 1978-2006. XLS Total sown area of crops in main years 1978-2007. XLS Total area sown to crops in main years 1995-2005. XLS Total sown area of crops in main years 1978-2012. XLS Total sown area of crops in main years 1978-2020.xls Main year crop sown area 1978-2018.xLS Crop sown area and multiple cropping index of main years 1952-1998. XLS Crop sown area and multiple cropping index of main years 1952-1999. XLS Crop sown area and multiple cropping index of main years 1952-2000. XLS Planting area and planting structure of crops 2000-2007. XLS Planting area and planting structure of crops 2000-2005. XLS Planting area and planting structure of crops 2000-2006. XLS Crop sown area and planting structure 2004. XLS Planting area and planting structure of crops 2005-2009.xLS Planting area and planting structure of crops 2006-2010. XLS Sown area and planting structure of crops 2007-2011. XLS Crop sown area and planting structure 2008.xls Crop sown area and planting structure 2009-2012. XLS Crop sown area and planting structure 2009-2013. XLS The sown area and planting structure of crops 2010-2014. XLS Sown area and planting structure of crops 2011-2015. XLS Crop sown area and planting structure 2012-2016. XLS Crop sown area and planting structure 2013-2017.xLS Crop sown area and planting structure 2013-2018.xLS Sown area and planting structure of crops 2015-2020.xLS The data table structure is similar. For example, there are 6 fields in the data table from 2000 to 2007: Field 1: Total sown area of crops Field 2: Food crops Field 3: Cash crop Field 4: Vegetables Field 5: melons and fruits Field 6: Other
Qinghai Provincial Bureau of Statistics
")
The data set records the investment situation of agricultural work relief in Qinghai Province, and the data is divided by the investment situation of agricultural work relief. The data are collected from the statistical yearbook of Qinghai Province issued by the Bureau of statistics of Qinghai Province. The data set consists of two data tables Investment in agricultural work relief, 1998-1999.xls, The investment of agricultural work relief in 1999-2000.xls. The data table structure is the same. For example, there are four fields in the 1998-1999 data table of agricultural work relief investment Field 1: irrigation and water conservancy Field 2: drinking water for human and livestock Field 3: Forestry Field 4: Grassland Construction
Qinghai Provincial Bureau of Statistics
")
The data set records the situation of agricultural modernization in Qinghai Province, and the data are divided by product name. The data are collected from the statistical yearbook of Qinghai Province issued by the Bureau of statistics of Qinghai Province. The data set consists of 9 data tables Agricultural modernization level in Main Years 1952-1998.xls Agricultural modernization level in Main Years 1952-1999.xls Agricultural modernization level in Main Years 1952-2000.xls Agricultural modernization 1978-1998.xls Agricultural modernization 1978-1999.xls Agricultural modernization 1978-2000.xls Agricultural modernization 1978-2001.xls Agricultural modernization 1978-2002.xls Agricultural modernization 1990-2003.xls data table structure is similar. For example, the data table of agricultural modernization from 1978 to 1998 has five fields Field 1: Agricultural Mechanization Field 2: application amount of agricultural chemical fertilizer (physical quantity) Field 3: agricultural electrification Field 4: irrigation and water conservancy Field 5: Grassland Construction
Qinghai Provincial Bureau of Statistics
")
This data set records the year-end ownership of agricultural machinery in Qinghai province from 1957 to 2020. Data in a diesel engine power, gasoline engine power, motor power and other mechanical power, large and medium-sized tractor (Taiwan), small tractors (ten thousand), large and medium-sized tractor supporting tools (Taiwan) and small tractor supporting tools (ten thousand), agricultural irrigation and drainage (Taiwan), combine harvester (Taiwan), mobile thresher (Taiwan), the farm transporter (car), fishing with machine Moving vessels (vessels) and irrigation and drainage facilities for agricultural use. The data are collected from qinghai Statistical Yearbook released by Qinghai Provincial Bureau of Statistics. The data set mainly contains 39 data tables, which are as follows: Annual ownership of agricultural machinery 1957-1998. XLS Annual agricultural machinery ownership 1957-1999. XLS Main years Agricultural machinery year-end ownership 1957-2000. XLS Main years Agricultural machinery year-end ownership 1957-2001. XLS Main years Agricultural machinery year-end ownership 1957-2002 XLS Annual ownership of agricultural machinery 1957-2004. XLS Main years Agricultural machinery year-end ownership 1957-2008. XLS Main years agricultural machinery year-end ownership 1957-2009. XLS Annual ownership of agricultural machinery 1957-2010. XLS Annual ownership of agricultural machinery 1957-2011. XLS Main years Agricultural machinery year-end ownership 1957-2006. XLS Main years Agricultural machinery year-end ownership 1957-2007. XLS Annual ownership of agricultural machinery 1965-2013. XLS Annual ownership of agricultural machinery 1965-2014. XLS Annual ownership of agricultural machinery 1965-2015. XLS Annual ownership of agricultural machinery 1965-2016. XLS Annual ownership of agricultural machinery 1965-2017. XLS Annual ownership of agricultural machinery 1965-2018. XLS Main years Agricultural machinery year-end ownership 1998-2005. XLS Annual ownership of agricultural machinery 1965-2012. XLS Main years and year-end ownership of agricultural machinery by region 1978-2003. XLS Year-end ownership of agricultural machinery 2000-2003. XLS Agricultural machinery year-end ownership 2000-2005. XLS Agricultural machinery year-end ownership 2000-2006. XLS Agricultural machinery year-end ownership 2000-2007. XLS Agricultural machinery year-end ownership 2004. XLS Agricultural machinery year-end ownership 2005-2009. XLS Agricultural machinery year-end ownership 2005-2010. XLS Agricultural machinery year-end ownership 2006-2011. XLS Agricultural machinery year-end ownership 2008-2012. XLS Agricultural machinery year-end ownership 2008. XLS Agricultural machinery year-end ownership 2009-2013. XLS Agricultural machinery year-end ownership 2009-2014. XLS Year-end ownership of agricultural machinery 2010-2015. XLS Year-end ownership of agricultural machinery 2011-2016. XLS Year-end ownership of agricultural machinery 2012-2017. XLS Year-end ownership of agricultural machinery 2013-2018. XLS Year-end ownership of agricultural machinery 2014-2019. XLS Year-end ownership of agricultural machinery 1965-2020. XLS The data table structure is similar. For example, the year-end ownership of agricultural machinery 2000-2003 data table has 6 fields: Field 1: indicator Field 2:2000 Field 3:2001 Field 4:2002 Field 5:2003 Field 6:2003 is % for 2002
Qinghai Provincial Bureau of Statistics
")
The data set records the basic situation of rural grassroots organizations and agriculture in Qinghai Province from 1978 to 2004, which is divided by industry, region, affiliation and registration type. The data are collected from the statistical yearbook of Qinghai Province issued by the Bureau of statistics of Qinghai Province. The data set consists of 9 data tables Basic situation of rural grassroots organizations and agriculture 1996-2001.xls Basic situation of rural grassroots organizations and agriculture 1997-2002.xls Rural grassroots organizations 1978-2001.xls Rural grassroots organizations 1978-2002.xls Rural grassroots organizations 1978-2003.xls Rural grassroots organizations 1990-1998.xls Rural grassroots organizations 1990-1999.xls Rural grassroots organizations 1990-2000.xls Rural grassroots organizations in 2004.xls The data table structure is similar. For example, the basic situation of rural grassroots organizations and agriculture in 1996-2001 has seven fields Field 1: Indicators Field 2: 1996 Field 3: 1997 Field 4: 1998 Field 5: 1999 Field 6:2000 Field 7:2001
Qinghai Provincial Bureau of Statistics
")
"The data set recorded the statistical data of rural electric power, farmland water conservancy construction and material consumption in Qinghai Province from 2000 to 2020. The data were divided by rural electric power, farmland water conservancy construction, agricultural chemical fertilizer application amount (discounted), agricultural plastic film use amount, agricultural diesel use amount and pesticide use amount, etc. The data are collected from qinghai Statistical Yearbook released by Qinghai Provincial Bureau of Statistics. The dataset contains 18 data tables, which are: Construction of rural electric power, irrigation and water conservancy and material consumption 2000-2005. XLS Rural electric power, irrigation and water conservancy construction and material consumption 2000-2006. XLS Rural electric power, irrigation and water conservancy construction and material consumption 2000-2007. XLS Rural electric power, irrigation and water conservancy construction and material consumption 2002-2003. XLS Construction of rural electric power, irrigation and water conservancy and material consumption in 2004.xls Rural electric power, irrigation and water conservancy construction and material consumption 2005-2009. XLS Rural power, irrigation and water conservancy construction and material consumption 2006-2010. XLS Rural power, irrigation and water conservancy construction and material consumption 2007-2011. XLS Rural electric power, irrigation and water conservancy construction and material consumption 2008-2012. XLS Construction of rural electricity, irrigation and water conservancy and material consumption in 2008. XLS Rural power, irrigation and water conservancy construction and material consumption 2009-2013. XLS Rural power, irrigation and water conservancy construction and material consumption 2009-2014. XLS Rural power, irrigation and water conservancy construction and material consumption 2010-2015. XLS Rural power, irrigation and water conservancy construction and material consumption 2011-2016. XLS Rural power, irrigation and water conservancy construction and material consumption 2012-2017. XLS Rural power, irrigation and water conservancy construction and material consumption 2013-2018. XLS Rural power, irrigation and water conservancy construction and material consumption 2014-2019. XLS Rural power, irrigation and water conservancy construction and material consumption 2015-2020. XLS The data table structure is the same. For example, the data table of rural electricity, irrigation and water conservancy construction and material consumption from 2000 to 2006 has 9 fields: Field 1: indicator Field 2:2000 Field 3:2001 Field 4:2002 Field 5:2003 Field 6:2004 Field 7:2005 Field 8:2006 Field 9:2006 is % of 2005"
Qinghai Provincial Bureau of Statistics
")
"Year of the data set recorded in qinghai province is mainly agricultural mechanization and grassland construction statistics, the data is according to the agricultural mechanization, the actual mechanical ploughing area, the area sown to the mechanical, mechanical harvesting area, grassland, enclosure grassland area, on the construction of artificial grass reserved area of rat damage area, years and years pest damage such as division of the area. The data are collected from qinghai Statistical Yearbook released by Qinghai Provincial Bureau of Statistics. The dataset contains 17 data tables, all of which have the same structure. For example, the data table from 2015 to 2020 has 7 fields: Field 1: indicator Field 2:2015 Field 3:2016 Field 4:2017 Field 5:2018 Field 6:2019 Field 7:2020"
Qinghai Provincial Bureau of Statistics
")
This data set records the statistical data of the total index of agricultural product production price in Qinghai Province in main years, and the data is divided by year. The data are collected from the statistical yearbook of Qinghai Province issued by the Bureau of statistics of Qinghai Province. The data set contains 30 data tables with the same structure. For example, the data table in 2018 has three fields: Field 1: year Field 2: month on month index (last year = 100) Field 3: fixed base index (1952 = 100)
Qinghai Provincial Bureau of Statistics
")
The data set records the statistical data of the total yield and variety composition of grain and oil crops in Qinghai Province in the main years, and the data is divided by year. The data are collected from the statistical yearbook of Qinghai Province issued by the Bureau of statistics of Qinghai Province. The data set consists of three data tables, namely, the total yield and variety composition of grain and oil crops in Main Years 1952-1998.xls, the total yield and variety composition of grain and oil crops in Main Years 1952-1999.xls, and the total yield and variety composition of grain and oil crops in Main Years 1952-2000.xls, with the same data table structure. For example, the data table in 2000 has four fields: Field 1: year Field 2: total grain production Field 3: species composition (%) Field 4: total oil production
Qinghai Provincial Bureau of Statistics

The data set is mainly included the population, arable land and animal husbandry data of Qinghai Province and Tibet Autonomous Region in the past 100 years. The data mainly comes from historical documents and modern statistics. The data quality is more reliable. It mainly provides arguments for the majority of researchers in the development of agriculture and animal husbandry on the Qinghai-Tibet Plateau.
LIU Fenggui

The data of farmland distribution on the Qinghai-Tibet Plateau were extracted on the basis of the land use dataset in China (2015). The dataset is mainly based on landsat 8 remote sensing images, which are generated by manual visual interpretation. The land use types mainly include the cultivated land, which is divided into two categories, including paddy land (1) and dry land (2). The spatial resolution of the data is 30m, and the time is 2015. The projection coordinate system is D_Krasovsky_1940_Albers. And the central meridian was 105°E and the two standard latitudes of the projection system were 25°N and 47°N, respectively. The data are stored in TIFF format, named “farmland distribution”, and the data volume is 4.39GB. The data were saved in compressed file format, named “30 m grid data of farmland distribution in agricultural and pastoral areas of the Qinghai-Tibet Plateau in 2015”. The data can be opened by ArcGIS, QGIS, ENVI, and ERDAS software, which can provide reference for farmland ecosystem management on the QTP.
LIU Shiliang, SUN Yongxiu, LI Mingqi

The data set was obtained from UAV aerial photography during the field investigation of the Qinghai Tibet Plateau in August 2020. The data size is 10.1 GB, including more than 11600 aerial photos. The shooting sites mainly include Lhasa, Shannan, Shigatse and other areas along the road, residential areas and surrounding areas. The aerial photos mainly reflect the local land use / cover type, facility agriculture distribution, grassland coverage and other information. The aerial photos have longitude, latitude and altitude information, which can provide better verification information for land use / cover remote sensing interpretation, and can also be used for vegetation coverage estimation, and provide better reference information for land use research in the study area.
LV Changhe, LIU Yaqun
")
In order to study the relationship between the spread of cyanine and human activities, we will resequence the cyanine varieties from the Qinghai Tibet Plateau and its surrounding areas, as well as Pakistan, India, Nepal, Germany, Japan and other places. At the same time, we will cluster the gene families, and make statistics of unique, shared genes and gene families. In addition, we will also carry out the analysis of gene family expansion and contraction, and system development Tree construction, genome-wide replication events and other analysis. The aim is to analyze the molecular basis of adaptation of traditional species of cyanine to the plateau under the dual pressures of human activities and regional climate. Therefore, this study is helpful to reveal the adaptive mechanism of cyanine to adapt to the plateau ecological environment and the influence of artificial domestication and human selection on its genetic differentiation in the process of evolution.
DUAN Yuanwen
")
The content of this data set is the measurements of body weight and body size (body height, body length, chest circumference, tube circumference) of 11 representative yak populations in Qinghai pastoral area at 2018. All the metadata comes from the work of body weight monitoring of yaks in Qinghai pastoral area at 2018, by the Northwest Institute of Plateau Biology, Chinese Academy of Sciences and Qinghai Academy of Animal Husbandry and Veterinary Sciences. The data set is named by “Monitoring Data Set of Body Weights of Traditional Grazing Yaks in Qinghai Pastoral Area (2018)”, consisting of 11 worksheets. The names and contents of worksheets are as follows: 1. Haiyan-Halejing (167 yaks in halejing Mongolian Town, Haiyan County, Haibei Tibetan Autonomous Prefecture); 2. Qilian-Mole (69 yaks in Mole Town, Qilian County, Haibei Tibetan Autonomous Prefecture); 3. Qilian-Yeniugou (42 yaks in Yeniugou Town, Qilian County, Haibei Tibetan Autonomous Prefecture); 4. Qilian-Yanglong (104 yaks in Yanglong Town, Qilian County, Haibei Tibetan Autonomous Prefecture); 5. Qilian-Ebao (28 yaks in Ebao Town, Qilian County, Haibei Tibetan Autonomous Prefecture); 6. Tianjun-Xinyuan (38 yaks in Xinyuan Town, Tianjun County, Haixi Mongolian and Tibetan Autonomous Prefecture); 7. Tianjun-Longmen (100 yaks in Longmen Town, Tianjun County, Haixi Mongolian and Tibetan Autonomous Prefecture); 8. Gande-Ganlong (36 yaks in Ganglong Town, Gande County, Guoluo Tibetan Autonomous Prefecture); 9. Guinan-Taxiu (70 yaks in Taxiu Town, Guinan County, Hainan Tibetan Autonomous Prefecture); 10. Henan-Kesheng (73 yaks in Kesheng Town, Henan Mongolian Autonomous Country, Huangnan Tibetan Autonomous Prefecture); 11. Ledu-Dala (50 yaks in Dala Town, Ledu District, Haidong City). This data set comprehensively evaluates the growth performance of yaks grazing in alpine meadow under the current ecological environment through the measurement of weight and body size data in the representative areas of Qinghai pastoral area. The data set can be compared with the growth characteristics of representative populations of Qinghai yaks measured in 1981 and 2008 recorded in 1983 and 2013, and the degradation index of growth performance of yaks grazing in Qinghai pastoral area can be obtained, which is helpful to assess the impact of ecological environment changes on the growth and production performance of grazing livestock.
JIA Gongxue, YANG Qien, Tianwei XU
 of countries along the Belt and Road(1961-2009)")
The data set records one belt, one road, 65 countries, 1961-2009 years of agricultural machinery (tractor) quantity and other relevant data. Agricultural machinery refers to the number of wheeled and tracked tractors (excluding horticultural tractors) used in agriculture at the end of a specified calendar year or the first quarter of the following year. Data source: Food and Agriculture Organization, electronic files and web site. Agricultural machinery reduces labor intensity, reduces hard labor, alleviates labor shortage, improves productivity and timeliness of agricultural activities, improves effective utilization of resources, increases market access, and helps reduce climate related hazards. In the future, agricultural machinery will play a greater role in ensuring the environmental sustainability of agriculture. The data set contains two data tables: Agricultural Machinery (tractors per 100 square kilometers of arable land), agricultural machinery (number of tractors).
XU Xinliang
")
By archaeological investigation and excavation in Tibetan Plateau and Hexi corridor, we discovered more than 40 Neolithic and Bronze Age sites, including Zongri, Sanjiaocheng, Huoshiliang, Ganggangwa, Yigediwonan, Shaguoliang, Guandi, Maolinshan, Dongjicuona, Nuomuhong, Qugong, Liding and so on. In this dataset, there are some basic informations about these sites, such as location, longitude, latitude, altitude, material culture and so on. On this Basis, we identified animal remains, plant fossil, selected some samples for radiocarbon dating, optically stimulated luminescence dating, stable carbon, nitrogen isotopes, polle, fungal sporen and environmental proxies. This dataset provide important basic data for understanding when and how prehistoric human lived in the Tibetan Plateau during the Neolithic and Bronze Age.
YANG Xiaoyan, Lü Hongliang, LIU Xiangjun, HOU Guangliang
")
The matching and zoning of water and land resources in Central Asian countries under the background of climate change can provide support for the development of water and land resources and agricultural production in Central Asian countries, and is of great significance to the social stability of the core region of the Silk Road Economic Belt. Based on the collected meteorological, water resources, land use and remote sensing data, the present situation of water and land resources development and utilization in Central Asia is analyzed. Based on the evaluating the characteristics and shortages of agricultural soil and water resources, using the DPSIR model and the theory of supply and demand, we constructed the index structure framework (SDCSL) of the study area, and the principal component analysis and cluster analysis are used to divide the regional of water and land resources utilization. Finally, we discussed the measures and ways to achieve the effective matching of agricultural water and land resources in different regions, so as to provide scientific reference and theoretical basis for the effective matching and sustainable development of regional agricultural water and land resources.
YAO Haijiao, LI Li, Food and Agriculture Organization of the United Nations(FAO)
")
The data set of agricultural activity intensity of the Qinghai Tibet Plateau is based on the County-Level Agricultural statistical data, including the annual cultivated land area, agricultural, forestry, animal husbandry and fishery labor force, total power of agricultural machinery, rural power consumption, effective irrigation area, pesticide use, fertilizer use, total output of grain crops, and total output value of agricultural, forestry, animal husbandry and fishery. The agricultural input index and output index are taken as the first level indicators, and the unit cultivated land area is constructed The intensity index system of agricultural activity is composed of 10 indexes, such as total power of agricultural machinery, fertilizer application amount per unit cultivated area and labor productivity. Entropy method was used to determine the weight of each index, and the input-output index of county-level agriculture in the Qinghai Tibet Plateau was obtained by AHP. The basic data comes from the statistical data released by the National Bureau of statistics, and the original data has been approved and corrected, with high reliability. The input-output index, input-output index and input-output index of county level in the Qinghai Tibet Plateau from 1980s to 2015 included in the data set reflect the spatiotemporal variation characteristics of the intensity of agricultural production activities in the Qinghai Tibet Plateau to a certain extent, and provide data support and theoretical reference for the local agricultural development.
LIU Yujie
")
Through the bioinformatics analysis after Hi-C sequencing, most of the sequences in the preliminary assembled genome sketch can be located on the chromosome, and the sequence and direction of these sequences on the chromosome can be determined, which lays an important foundation for obtaining high-quality sequence map. Therefore, by using this technology, the research team can divide the sequence in the sketch of the genome sequence of Aralia racemosa into groups with the same chromosome number as the species, and determine the order and orientation of all sequences in each group. After that, we can combine the data of reference genome, EST sequence, related species and genetic map of Aralia racemosa The accuracy of grouping and the order and direction between sequences were evaluated.
DUAN Yuanwen
")
The data includes the county-level data of characteristic agriculture distribution in the Qinghai Tibet Plateau, which lays the foundation for the spatial distribution and development of characteristic agriculture in the Qinghai Tibet Plateau. The data comes from the planning documents of each province in the Tibetan Plateau region, such as the development plan of the characteristic agricultural products base of the Tibetan Plateau (2015-2020). The data is the distribution of characteristic agriculture at the county level, including four kinds of agricultural products: highland barley, yak, sheep and wolfberry. The spatialization of main agricultural products of characteristic agriculture at the county level is realized. The time range is set to 2015-2020, referring to the planning and construction time of characteristic agriculture in each province in the data source. The data can be applied to the research on the spatial distribution of characteristic agriculture and the development of characteristic agriculture in the future.
SHI Wenjiao
")
Research on the spatial distribution and dynamic change of soil and water heat in Central Asian countries under the background of climate change can provide support for the development of water and soil resources and agricultural production in Central Asian countries, which is of great significance for the social stability of the core region of the "Silk Road Economic Belt". Based on meteorological, water resources, land use and remote sensing data, this paper analyzes the current situation of water and soil resources development and utilization in Central Asia, and introduces the water and heat product index as the water and heat factor, and uses linear trend analysis and partial correlation analysis to study the spatial and temporal variation characteristics of water and soil heat resources in Central Asia in 1995, 2005 and 2015 Equivalent coefficient is used to evaluate the matching characteristics and shortage degree of agricultural water and soil resources. The data set adopts Albers projection, including the spatial distribution of annual precipitation resources, heat resources and cultivated land resources in Central Asia. This data set is intended to provide basic data for the follow-up analysis of agricultural resources, natural regionalization and vulnerability of water, soil and heat resources in Central Asia.
ZHOU Hongfei, YAO Haijiao, LI Li, Food and Agriculture Organization of the United Nations(FAO)
")
In this study, the cultivated land, forest land and grassland of the Qinghai Tibet Plateau in 2015 were taken as the evaluation objects to analyze the terrain, climate, soil and vegetation factors (terrain: altitude, slope; climate: sunshine hours, ≥ 0 ℃ accumulated temperature, annual average precipitation; soil: soil texture, soil erosion intensity, soil layer thickness; vegetation: vegetation type, NDVI) that have significant impact on land sensitivity and establish agriculture Land sensitivity evaluation index system. Using AHP method to determine the weight of evaluation factors, according to the ArcGIS Jerks classification method to get the sensitivity level of cultivated land, forest land and grassland, output 250m resolution of the Qinghai Tibet Plateau agricultural land sensitivity map, and verify the results.
YAO Minglei
")
Based on the calculated ecological environmental risk of agriculture and animal husbandry in 1985, 1990, 1995, 2000, 2010 and 2015 on the Tibetan Plateau, the fuzzy weighted Markov chain model was used to predict the ecological environmental risk without the meteorological factors.The meteorological factors data extracted from future climate model (rcp4.5) was superimposed with ecological environmental risk of agriculture and animal husbandry without the meteorological factors. The resulting risk of agriculture and animal husbandry development in 2030, 2050 and 2070 can provide scientific basis for the future development planning of agricultural and animal husbandry on the Tibetan Plateau.
LU Hongwei
Based on the ecological environmental risk data of the development of agriculture and animal husbandry in 2030, 2050 and 2070 in the Qinghai Tibet Plateau, the risk values of agriculture and animal husbandry in the six typical years of 198519901995200002010 and 2015 are calculated, and the predicted value of ecological environmental risk in 203020502070 is calculated by using the fuzzy weighted Markov chain model. The grid map of meteorological factors extracted from ArcGIS and the future climate model (rcp4.5) was superimposed to obtain the data of agricultural and animal husbandry ecological environment risk in the Tibetan Plateau in 203020502070.
LU Hongwei
")
The data set records the cereal yield of of 1961-2016 countries along 65 countries along the belt and road. Data sources: Food and Agriculture Organization, electronic files and web site.The data are collected by the Food and Agriculture Organization (FAO) of the United Nations through annual questionnaires and are supplemented with information from official secondary data sources. The secondary sources cover official country data from websites of national ministries, national publications and related country data reported by various international organizations.Data on agricultural land in different climates may not be comparable. For example, permanent pastures are quite different in nature and intensity in African countries and dry Middle Eastern countries. The dataset contains 2 tables:Cereal production (metric tons),Cereal yield (kg per hectare).
XU Xinliang
")
The data set contains agricultural economic data of all counties and regions in the Tibetan Plateau in 1980-2015, and covering the total number of households and total population in rural areas, agricultural population, rural labor force, cultivated land, paddy field area, the dry land area, power of agricultural machinery, agricultural vehicles, mechanical ploughing area, irrigation area, consumption of chemical fertilizers electricity use, gross output value of agriculture, forestry, animal husbandry and fishery, the output of cattle, pig, sheep, meat, poultry, and fish, the sown area of grain, the output of grain, cotton, oil and all kinds of crops, and characteristic agricultural products and livestock production and other relevant data.The data came from the statistical yearbook of the provinces included in the Tibetan Plateau.The data are of good quality and can be used to analyze the socio-economic and agricultural development of qinghai-tibet plateau.
LV Changhe
 (2008-2015)")
The Tibetan Plateau in China covers six provinces including Tibet, Qinghai, Xinjiang, Yunnan, Gansu and Sichuan, including Tibet and Qinghai, as well as parts of Xinjiang, Yunnan, Gansu and Sichuan. The research on water and soil resources matching aims to reveal the equilibrium and abundance of water resources and land resources in a certain regional scale. The higher the level of consistency between regional water resources and the allocation of cultivated land resources, the higher the matching degree, and the superior the basic conditions of agricultural production. The general agricultural water resource measurement method based on the unit area of cultivated land is used to reflect the quantitative relationship between the water supply of agricultural production in the study area and the spatial suitability of cultivated land resources. The Excel file of the data set contains the generalized agricultural soil and water resource matching coefficient data of the Tibetan Plateau municipal administrative region in China from 2008 to 2015, the vector data is the boundary data of the Tibetan Plateau municipal administrative region in China in 2004, and the raster data pixel value is the generalized agricultural soil and water resource matching coefficient of the year in the region.
DONG Qianjin, DONG Lingxiao
")
This study takes the land resources in the Qinghai-Tibet Plateau as the evaluation object, and clarifies the current situation in the region suitable for agriculture, forestry, animal husbandry production and the quantity, quality and distribution of the reserve land resources. Through field investigations, collect relevant data from the study area, and combine relevant literature and expert experience to determine the evaluation factors (altitude, slope, annual precipitation, accumulated temperature, sunshine hours, soil effective depth, texture, erosion, vegetation type, NDVI). The grading and standardization are carried out, and the weights of each evaluation factor are determined by principal component analysis. The weighted index and model are used to determine the total score of the evaluation unit. Finally, the ArcGis natural discontinuity classification method is used to obtain the Qingshang Plateau. And the grades of farmland, forestry and grassland suitability drawings of the Qinghai-Tibet Plateau with a resolution of 90m were given. Finally, the results are verified and analyzed.
YAO Minglei

The data of Land Resources Productivity for “B&R” includes: 1. Areas of cultivated land resources in regions and countries along the “B&R”; 2. Data on grain planting area and total grain output in regions and countries along the “B&R”; 3. Major crops (rice, wheat, corn) in regions and countries along the route Planting area and production data; 4. Areas of grassland resources in the region and along the country; 5. Number of livestock (bovine, sheep) in the region and along the country. Source: Cultivated land and population data from the World Bank database; food, crop, grassland, and livestock data are from FAO. Data application: According to the data provided, the basic characteristics analysis of land resources and the analysis of land resource output can be carried out in the Belt and Road region and the countries along the route, so that the land resource productivity evaluation analysis can be carried out.
YANG Yanzhao
")
The data on the consumption and trade of agricultural products for the period 1992-2016 in the five Central Asian countries are derived from the Food and Agriculture Organization of the United Nations (FAO) food statistics database. The main elements include: crop types and yields, crop sown area, breed species and scale, animal product output, dietary structure, population, policy technology, total import and export amount and amount, etc. It can be used to support the development and utilization of agricultural water and soil resources in Central Asia, and the measurement and management of the "virtual water" and "virtual soil" resources contained in agricultural products. It provides the basic data support for the agricultural products trade complementation and agricultural cooperation decision making between China and the five Central Asian countries, and guarantees and promotes the construction of the Silk Road economic belt.
YANG Yonghui, HE Li
")
By archaeological investigation and excavation in Tibetan Plateau, we discovered 14 historic period sites, including Meinuo, Sariguo, Rongwaguo, Kaze, Jiha, Yarigei, Bami, Barongbadang, Qingtu, Labu ,Maisong Petroglyph, Gala, Yezere 1 and Yezere 4 . In this dataset, there are some basic informations about these sites, such as location, longitude, latitude, altitude, material culture and so on. On this Basis, we identified animal remains, plant macrofossil, selected some samples for radiocarbon dating and stable carbon and nitrogen isotopes. This dataset provide important basic data for understanding when and how prehistoric human lived in the Tibetan Plateau during the historic period.
DONG Guanghui , HOU Guangliang

In order to explore how and when turnip was successfully domesticated the Qinghai-Tibet Plateau and what is the relationship between turnip domestication and early human settlement on the Qinghai-Tibetan Plateau and human migration along the ancient Silk Road, the whole genome De Novo sequencing of a self-bred F1 variety on Qinghai-Xizang Plateau was conducted, with the assembled genome size of 409.69 Mb,Contig N50 was 1.21 Mb in June 2018 using Pacbio sequencing. Those data will provide a genetic basis for elucidating the relationship between plant disperse and human activities. As we know, traditional turnip landrace is influenced by human domestication and nature selection. Hopefully, the study will help to understand the impacts of human selection on turnip genetic differentiation, and the adaptation mechanism of turnip in the Qinghai-Tibetan Plateau.
DUAN Yuanwen
")
The data include the data of cattle stock at the end of the year of Tibetan Plateau . The spatial area is divided by counties on the Tibetan Plateau. The time resolution is 5 years, and the time coverage is 2000, 2005, 2010.This data is obtained through statistics and collection of relevant literature, historical database records and other materials, and other data are acquired through purchase.The data can be used to analyze the agricultural production and meat price changes of each county on the Tibetan Plateau. In addition, the development differences of each county on the Tibetan Plateau can also be analyzed by comparing the data of the counties.
YANG Fei

The data set include crop leaf stomatal conductance observed at four sample regions, that is the soil moisture control experimental field at Daman county, and the super station, and Shiqiao sample plots at Wuxing village in Zhangye city. 1) Objective Crop leaf stomatal conductance, a key biophysical parameter, was observed as model parameter or a priori knowledge for crop growth model, or evapotranspiration estimation. 2) Measuring instruments Leaf porometer. 3) Measuring site a. the soil moisture control experimental field at Daman county, Twelve soil water treatments are set. The crop leaf stomatal conductance for each treatment is measured on 17, 23 and 29 May, and 3, 9, 14 and 24 June, and 5 and 12 July. b. the Super Station The crop leaf stomatal conductance at the super station is measured on 22 and 28 May, 5, 11, 18, and 25 June, and 1, 8, 15, 22 and 31 July, 9, 15 and 22 August, and 3 and 11 September. c. the Shiqiao sample site The crop leaf stomatal conductance at the Shiqiao village is measured on 17, 22 and 28 May, 4, 11, 17 and 25 June, 1, 8, 15, 22, and 30 July, 8, 16 and 27 August, and 9 September. 4) Data processing The observational data was recorded in the sheets and reorganized in the EXCEL sheets. The time used in this dataset is in UTC+8 Time.
Xu Fengying, Wang Jing, Huang Yongsheng, LI Xin, MA Mingguo
")
1. Overview of data This data is based on the latest googleearth remote sensing image data to establish the spatial distribution database of crops in Ganzhou District of Zhangye City. 2. Data content Based on the spatial distribution of maize seed production focused by the project, the land use types in the study area are divided into 14 types (maize seed production land, spring wheat land, vegetable land, greenhouse land, intercropping land, rice land, water area, wetland, forest land, urban and rural industrial and mining residential land, roads, railways and unused land). 3. Space-time range The data range includes 19 villages and towns including Pingshanhu, Shajing, Wujiang River, Jingan, Mingyong, Sanzha, Ganjun, Xindun, Shangqin, Jiantan, Chengguan Town, Liangjiadun, Chang 'an, Dangzhai, Xiaoman, Longqu, Daman, Huazhai and Anyang. The data type is vector polygon and stored in Shape format. The data range covers Ganzhou District.
XU Zhongmin
")
According to the characteristics of the selected field and its surrounding area, a trime tube is arranged in the corn field, and 5 trime tubes are arranged in a direction perpendicular to the field path. When monitoring soil moisture content in the TDR vertical direction, the unit is every 10cm. Monitor down. Location: N 38 ° 52′27.6 ″ E 100 ° 21′14.0 ″ The submitted data includes the water content of the farmland and its surrounding soil (TDR monitoring) after three irrigations in a selected farmland in Yingke Irrigation District, encrypted monitoring after irrigation, one group every 3 hours within 24 hours, and 3 groups per day for the next 5 days. -10 days are two groups per day, and 10-15 days are one group per day.
HUANG Guanhua, JIANG Yao
")
The field experiments of water consumption and irrigation water productivity of corn and cotton were arranged in 2012 and 2013, and the field experiments of irrigation water productivity of corn and sunflower under different mulching and cultivation methods were arranged in 2014. The characteristics of water consumption and irrigation water demand of three crops under different soil conditions, as well as the relationship between key soil properties and crop yield and irrigation water productivity were obtained.
SU Yongzhong
Contact Support
Links
National Tibetan Plateau Data CenterFollow Us

A Big Earth Data Platform for Three Poles © 2018-2020 No.05000491 | All Rights Reserved
|  No.11010502040845
Tech Support: westdc.cn